


For most people, images are the most effective way to process information. In the same way that kids prefer picture books to plain-text literature, adults resonate better with visually rich charts and diagrams compared to traditional descriptive paragraphs.
With decreasing global attention spans, it’s important for marketers to give users a way to quickly absorb valuable content. That’s why infographics have become a powerful and widely used tool among communication teams.
Venngage offers marketers infographic templates that can be used as visual assets to assist with your marketing communication campaign. Simply sign up for a free account and start designing, using the easy-to-use editor and fully customizable templates.
Click to jump ahead:
- What is marketing communication?
- The role of infographics in marketing communication
- 7 tips for an effective marketing communication campaign
Marketing communication: definition, impact and success metrics
What is marketing communication?
By definition, marketing communication—or marcom, for short—comprises activities that inform, engage users and persuade them to make buying decisions.
Marketing communication is also referred to as Integrated Marketing Communication or IMC.
What is the role of marketing communication?
Marketing communication sets brands apart from everybody else on the market. Along with the product/service itself, the words and techniques you choose to introduce people to the company help prospective customers choose your offer.
This decision is taken not only after research and competitor analysis but emotionally, based on the affinity of values and tone of voice from the brand. Thus, marketing communication is a way to build a unique connection between the company and its followers.
What are the different types of marketing communication?
The most common strategies teams use to connect with audiences are:
- Advertising
- Public relations (issuing press releases, partnering with media outlets, etc.)
- Sales promotions (discount coupons, premium offers, etc.)
- Social media marketing
- Email marketing
- Mobile marketing (in-app notifications, ads, etc.)
Here’s an example of an email newsletter that can be part of an IMC campaign on Valentines promotion for a cosmetics company:

In addition to having sales promotions in their online store and/or at their brick-and-mortar locations, Femina Cosmetics can also send out email newsletters like these to their customers to inform them of the discount.
What are the key metrics and milestones of marketing communication success?
Metrics and milestones help measure the success of marcom tactics. Here are the 3 factors that determine the efficiency of the IMC strategy:
- Return on investment (ROI)
Before launching a campaign, team leaders should set ROI projections. After the strategy is fully deployed, marketers compare how the campaign performed compared to the original estimate. Such reflection gives team leaders the possibility to commit to effective strategies and cut off those that don’t deliver.
- Customer retention
Marketing communication campaigns are successful if they help keep first-time visitors on the website or encourage one-time customers to make new purchases.
- Increased brand awareness and a higher number of brand messages and mentions
Spreading the word about the product is a key goal of marketing and communications. Thus, if, after interacting with branded content, people talk about their experience online or join the company’s social media pages, a campaign can be labeled a success.
What is effective communication in marketing?
Marketers use a lot of tactics and techniques to improve the efficiency of marketing communication, starting from brand asset management tools for effective distribution of marketing materials to new forms of communication bringing new life to old content. However, at the end of the day, it boils down to one straightforward goal: using less (time, effort, content) to say more.
To that end, visuals are a powerful instrument. After all, a picture is worth a thousand words, so relying on graphics helps marketers be precise with their messages and have greater appeal to audiences.
Let’s find out how infographics help boost the impact of marketing communication.
The role and application of infographics in marketing communication
In 2021, infographics are not only popular but a highly efficient way to engage website visitors and social media followers.
Statistically, 65% of B2B marketing teams used visually rich charts and graphs to interact with audiences. 84% of business owners who added infographics to their marketing strategies found this type of content engaging and effective.
Why do users resonate so well with visual content? Here are a few compelling benefits of using infographics over other mediums:
1. Most people respond to images
According to studies, 65% of the planet are visual learners. This means that marketers should maximize the visual appeal of their posts. To that end, using infographics is a smart way to complement (or replace) content-heavy blog posts.
By leveraging the power of visual content, marketing communication managers expand their audiences and encourage more users to engage with marketing collateral.
2. Helps revive old content
Marketing teams successfully use infographics to dominate visually-driven social media platforms like Instagram or Pinterest. Turning an older post into an engaging visual helps make the most out of the team’s work and puts a new spin on posts that didn’t perform extremely well in plain text.
Here’s an example of a mini infographic Venngage used for the 2020 visual content marketing survey:

As you can see, this infographic is perfect to be used in any posts about content marketing to back up claims on the effectiveness of visuals in marketing (which is what I’m doing right now). It’s a bit meta, but you get the point.
3. Enable sales and onboarding
Other than holding the attention of first-time users, infographics are a powerful tool that sales managers can use to add value to demo calls and speed up deal negotiations.
Here’s an example of an infographic that can be placed on a tutoring company’s website or sent to potential leads to further stress their unique selling proposition:

The impact of visual content on sales enablement is huge. According to a study by Pinterest, posts that show products in action improve conversions by 67%.
How marketers use infographics and other visuals in marketing communication
There are different ways for marketers to use infographics, and here are the most common applications:
- Adding infographics to other types of content: blog posts, ebooks, white papers
- Posting visual content on social media: infographics add value and context to plain text posts
- Sharing custom infographics on other websites helps generate high-quality backlinks and attract relevant traffic
- Using infographics for internal communication: creating step-by-step process guides for teammates, sharing visually rich reports, and leveraging the format to succinctly present ideas
- Distribute your infographics on social media and use an AI voice generator to explain the infographic to people with visual impairments.
In fact, according to Venngage’s 2020 visual content marketing survey, 34% of marketers use original graphics such as infographics and illustrations in their content:

People also read:
- Marketing Infographics: The Definitive Guide [Includes Infographic Templates]
- How Mini Infographics Improve On-Page SEO
- How to Get Better Backlinks with Guestographics
- [Case Study] How We Scaled Wordable’s SEO Content Strategy and Increased Organic Traffic By 86 Percent
7 tips for an effective marketing communication campaign
Sleek, catchy, visually appealing—these are the descriptive adjectives used when discussing visual content. After all, creating content that keeps users hooked is a designer’s goal.
However, making an infographic that breaks through data noise is not straightforward. There are precise tools and strategies marketers use to stand out. Here are 7 tried-and-true practices that help business owners leverage the full power of visual content.
- Spice up your blog posts
- Add infographics to emails
- Use a central core message
- Research and credit data sources
- Don’t overdo branding
- Optimize distribution
- Streamline production
Tip #1. Spice up your blog posts
Despite their value, text-heavy materials are challenging to read. To add more variety to blog posts, it’s a good idea to mix text-based content with an engaging infographic. Here are a few ideas to help content marketers get started:
- Highlight data and statistics by adding them to infographics
This way, the key values in the post will leave a long-lasting impression in a visitor’s mind.
You can even take this up another level and create original research content for your blog post, which is what Venngage did with the Visual Content Marketing Statistics post.

The statistics obtained from original research surveys can be repurposed to use on multiple channels (blog, email newsletters, social media posts, video content and more)—which is perfect for an integrated marketing communication campaign.
Original research content like this one not only helps establish you as a thought leader in your industry but also creates multiple PR and backlink opportunities.
- Make a statement
Recently, infographics are getting more recognition as a way to spread awareness about societal issues or specific industry questions. That’s why visual summaries are a powerful addition to thought leadership pieces: they help readers summarize the main points of the post.
Let’s come back to the Visual Content Marketing Statistics blog. In addition to having mini infographics to illustrate each statistic, Venngage also has a long infographic summarizing the result of the entire survey. Here’s a snippet of it:

You can click the infographic to learn more about the other 10 statistics on visual content marketing, or read the blog: 14 Visual Content Marketing Statistics to Know for 2020 [Infographic]
- Explain challenging processes
Step-by-step infographics or hierarchical infographics are popular for a reason—they give readers easy-to-apply instructions. Marketers should use the fact that people are great at following visual directions by turning how-to posts into infographics.
The infographic below offers a 5-step guide to nonprofit email marketing, but you can customize it to explain any process you wish your audience could understand better.

Infographics like these are perfect to be used in emails too, and we’ll talk more about this in the next tip.
Return to Effective Marketing Communication tips
Tip #2. Add infographics to emails
Recent heat map studies show that email readers aren’t engaging with text-heavy sections of a marketing message effectively. Instead, they prefer focusing on larger elements like images, icons, diagrams, and charts.
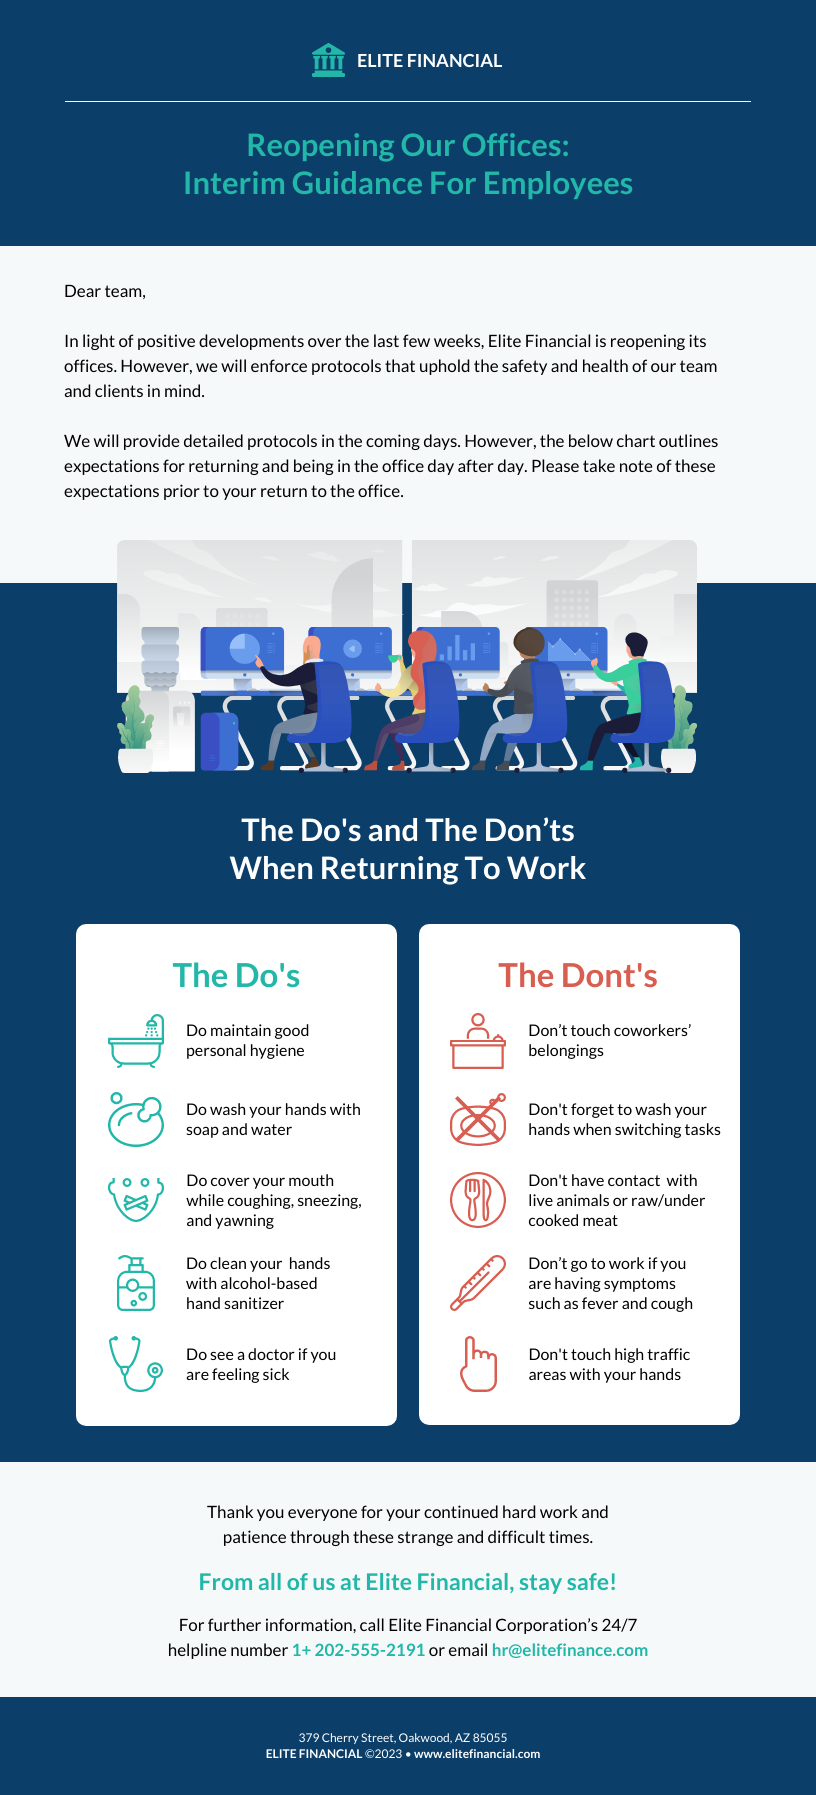
Here’s an example of an email that makes the most use of icons and illustrations. It’s meant to be sent internally, but you can customize it for your regular external email marketing campaign:
Adding infographics to emails helps maximize user engagement with the campaign. Here are a few creative campaign ideas marketers can draw upon:
- Long-form text emails transformed into engaging infographics
- Adding infographics to emails as a summary
- Using visual content to highlight product benefits in promotional emails
- Share an infographic-based how-to email that has high odds of going viral
As mentioned above, the 5-step guide to nonprofit email marketing can be repurposed as an email. As a paid Venngage user, you can download the infographic as a PNG or PDF and attach it to your email:

A Business Venngage user has the option to export the email as an HTML file and import it to Mailchimp or Outlook for a clickable email campaign. Here’s how to do it:
Return to Effective Marketing Communication tips
Tip #3. Use a central core message
Infographics are a powerful way to share interesting facts, figures, and statistics. However, there can be a tendency to go overboard with data.
Don’t overwhelm readers with data. Instead, design a visual around one topic and pick a clear core message. A few streamlined and easy-to-understand infographic ideas are:
- X best practices for [customer goal, pain point]
- Why [topic name] is here to stay
- Interesting facts about famous people or high-performing companies
- Location-based infographics
- X vs Y: a great way to explain differences between concepts
A blog on SEO vs. PPC, for example, can be summed up in this comparison infographic template to showcase the main differences:

Return to Effective Marketing Communication tips
Tip #4. Research and credit data sources
The value of infographics is in research and data-drivenness. The most shared and impactful infographics like “Where The World’s Banks Make The Most Money” or “How Tech Giants Make Their Billions” are rooted in thorough research.
Before you turn content into visuals, make sure there’s enough data to support claims. Research-driven designs have high virality odds, and marketers can get extra backlinks by offering an in-depth view of an industry or a trend.
Make sure to credit the resources you use. For one thing, it spares teams the risk of lawsuits. Also, giving credit where it’s due gets brands stellar reputation and can spike meaningful partnerships between the company and independent researchers.
Related:
- 10+ Data Infographics and Best Free Data Sources You Should Bookmark
- How to Source and Cite Infographics: A Complete Guide
Return to Effective Marketing Communication tips
Tip #5. Don’t overdo branding
Branding elements are an asset to marketing designs as they promote awareness and help companies stand out. However, as with most things, there’s a fine line that marketers shouldn’t cross.
Here’s when branding gets too much:
- Watermarks and logos steal the spotlight from content and valuable data
- Too much branding content makes the infographic feel like an ad
- Clumsy watermarks aren’t aesthetically pleasing so readers don’t enjoy interacting with and sharing the infographic
Here’s when branding is “just enough”:
- Marketers use branded colors and fonts
- There’s a mention of the creator and a logo
- The infographic reflects the company’s tone of voice
Let’s take a look at this comparison infographic:

This is a good example of branding done right. The logo and the colors don’t steal the spotlight from the main content. In fact, brand colors are used strategically to make the “Enterprise” plan stand out without making it too “salesy”.
As you customize this infographic, you may wonder how you can quickly change it to reflect your own company’s branding guidelines. This is when Venngage’s My Brand Kit comes in handy.
Simply type in your website and have your branding elements automatically uploaded to your brand kit:

And once that’s all set up, apply your brand colors and logos to your design in a few clicks:
Return to Effective Marketing Communication tips
Tip #6. Optimize distribution
Designing a sleek and valuable infographic is, on its own, a success. However, if your designs get no visibility, the team’s efforts will not pay off to the fullest.
To spread the word about infographics online, it’s important to optimize them for SEO and build a distribution funnel.
A checklist for optimizing infographics for search engines:
- Add text to the page that features the infographic; otherwise, bots won’t crawl the page and it won’t rank
- Add an alt-tag to the image to make sure a user knows what the visual is about before it loads
- Give files descriptive names (e.g. “best-marketing-communication-practices” instead of “infographic01”)
- Add the word “Infographic” to the header to make sure Google bots know there’s visual content on the page
- Use target keywords for page URLs
Related:
A step-by-step infographic distribution plan:
- Add social sharing icons to make sure readers can spread the word about your post
- Optimize the infographic for social media image requirements
- Share infographics in email campaigns
- Publish your content on third-party blogs to generate backlinks and relevant traffic
Return to Effective Marketing Communication tips
Tip #7. Streamline production
Statistically, making infographics is a challenging process. Designers rated the process 7 out of 10 by difficulty.
To keep up a steady pace when designing complex visuals, teams rely on design solutions. By using platforms like Venngage, marketers can speed up the process.
With the Venngage Business plan, the design process is even faster as you can collaborate with your team members in real time and finish a design together:

Venngage puts thousands of ready-to-edit infographic templates at your team’s fingertips. Thus, designers don’t have to spend hours building blocks and icons in Illustrator. Once you’ve put in the copy, tweaked the fonts and colors, the infographic is ready to go live.
Conclusion: Use infographics to get the most out of your marketing communication campaign
Infographics are a commitment for the marketing team.
To make compelling visuals, teams need to brainstorm consistently, and carefully watch design trends. However, once you’ve designed an infographic, its performance can outlive other content formats by years.
Infographics are an engagement magnet on social media, perform well in email campaigns, and are an effective IMC strategy for reusing the brand’s older content.
To create designs that resonate with readers and encourage them to learn more about the brand, explore creative infographic ideas. The Venngage template gallery is a good place to start. Get inspired by our top designs and build a killer custom infographic!


