


By their nature, numbers have a certain inflexible quality. While infographics are uniquely suited for numbers-based storytelling, that often means a human connection is sacrificed in the name of data. But the use of a people infographic format can restore missing personal touch.
A people infographic is one in which human figures drive the storytelling. This is done through the use of photographs, icons, pictograms, illustrations or avatars. While this approach is an ideal way of injecting emotion into numbers-based stories, people infographics can also be used for topics that rely less on data.
Using Venngage’s Infographic Maker is an ideal way to bring a human touch to your infographics, as it features more than 400 human illustrations and icons that you can customize to suit your needs.
![]()
NEW! Introducing: Marketing Statistics Report 2022
It’s 2022 already. Marketers, are you still using data from pre-COVID times?
Don’t make decisions based on outdated data that no longer applies. It’s time you keep yourself informed of the latest marketing statistics and trends during the past two years, and learn how COVID-19 has affected marketing efforts in different industries — with this FREE marketing statistics report put together by Venngage and HubSpot.
The report uses data gathered from over 100,000 customers of HubSpot CRM. In addition to that, you’ll also know about the trends in using visuals in content marketing and the impacts of the pandemic on visual content, from 200+ marketers all over the world interviewed by Venngage.
Grab your copy now — it’s not like any other marketing reports out there, plus it’s 100% free!
In the meantime, let’s explore examples of people infographics and delve into what you should know about creating a people infographic that makes the most of the format.
Want to learn more about other types of infographics? Read our blog on the 9 types of infographics or watch the video below:
Click to jump ahead:
- The science of people infographics
- When to create a people infographic
- Infographics with photos of people
- Infographics with people icons and illustrations
- Best practices for people infographics
The science of people infographics
If you’ve ever had the experience of seeing a human face in your toast or in a grouping of leaves on a tree, you have your brain to thank for that. Science has shown that the human brain is constantly searching for faces in everything it sees.
Similarly, including depictions of people in infographics stimulates the brain’s desire to find other people in the images it sees. Let’s take a look at two infographics that tell different sides of a story to illustrate this point.

This infographic connects the audience directly with the people impacted by the pandemic-related refugee crisis unfolding around the world in 2020 and 2021. The eye is immediately drawn to the illustration of a young woman at the top left.
Every piece of data in the infographic is related in some way to the plight of refugees, though the data types themselves are different. Numbers, ratios and percentages all go into telling this story.

This example shares information about the refugee crisis from another angle, which is comparing how different nations responded. Very little human imagery is used, and this creates a somewhat clinical feel.
While that’s certainly not a bad thing, in cases where you want your audience to make an emotional connection, it’s easy to see the impact that centering people would have.
When to create a people infographic
The short answer to the question of when you should turn to a people infographic is an easy one: If the topic of the infographic or its purpose involves humans, it’s tough to go wrong with a people infographic.
That makes people infographics among the most diverse since every infographic that’s ever been made has at least one thing in common: They were all made for people. Regardless of the topic or the story being told, the audience for every infographic is humans.
This is by no means an exhaustive list, but here are some examples of the types of stories that are the best match for a people infographic approach:
- Survey data
- Organizational charts
- Lists
- Tips
- Demographics
- User/reader data
- Populations
- Leaderboards
- Comparisons
- Economic data
- Health data
- Technology data
Infographics with photos of people
Using images of real people is the most ideal method of adding human imagery to your infographics because it immediately grounds your content in reality. It’s also the most limiting, as it typically will apply only to internal stories or external data that’s about famous individuals.
There are also technical limitations that may apply. Low-resolution photographs can seriously damage the effectiveness and quality of your infographic. That said, assuming it applies and you can get your hands on high-resolution files, photography is the gold standard.

In this example above, an organizational chart is illustrated with photographs of the people mentioned. In addition to encapsulating each personality, this approach has a huge but simple benefit: A new team member adds faces to names in getting to know their colleagues.
Here’s another example of how you can use photos of actual people in your infographics:

Another approach would be using illustrations or avatars for these people, and we’ll talk in a moment about when that’s appropriate. But not being able to show real faces often forces you to rely on stereotypes of facial features or hairstyles, so that type of illustration is tricky for audiences for whom diversity and inclusion are critical.
Using photography in infographics is ideal for many internal uses like change management, which is a notoriously difficult process for any organization. But using actual images of real colleagues can make it less intimidating.
This collection of quotes from women at Venngage pairs real pictures of female team members with their lived experiences working in the tech space. Seeing their words is powerful, and adding their faces reinforces that effect.

Personal portraits aren’t the only way to add a photographed human touch, as this Father’s Day infographic shows. In fact, we can’t even see the faces of the father and child depicted, but the emotional impact is immediate.

This simple infographic that shares techniques to manage crises in the workplace uses photography to reinforce the point that a workplace is made up of real people with real needs and emotions.

Infographics with people icons and illustrations
Usually if you’re considering creating a people infographic for your visual communications needs, you’re talking about using people icons and illustrations. This could include detailed illustrations or simple pictogram icons and everything in between.
Below is an example of how people icons can be used instead of actual photos:
![]()
Drawn or illustrated people are generally preferred because with an illustration, it’s easier to create what you want rather than having to rely on how a person looked when they had their picture taken. Need them in a different shirt or with a different expression? No problem.
For this reason, people infographics will usually employ the use of illustrated representations of people, and these may be referred to as cartoons, characters, avatars, icons or vectors.
![]()
Drawn people images can be heavily stylized and detailed, as this style from Venngage’s Infographic Maker shows. While no faces are depicted, each person is shown doing a physical activity that’s immediately identifiable.
This type of illustration is ideal in healthcare or medical campaigns aimed at patient education, like this example from the Centers for Disease Control and Prevention.
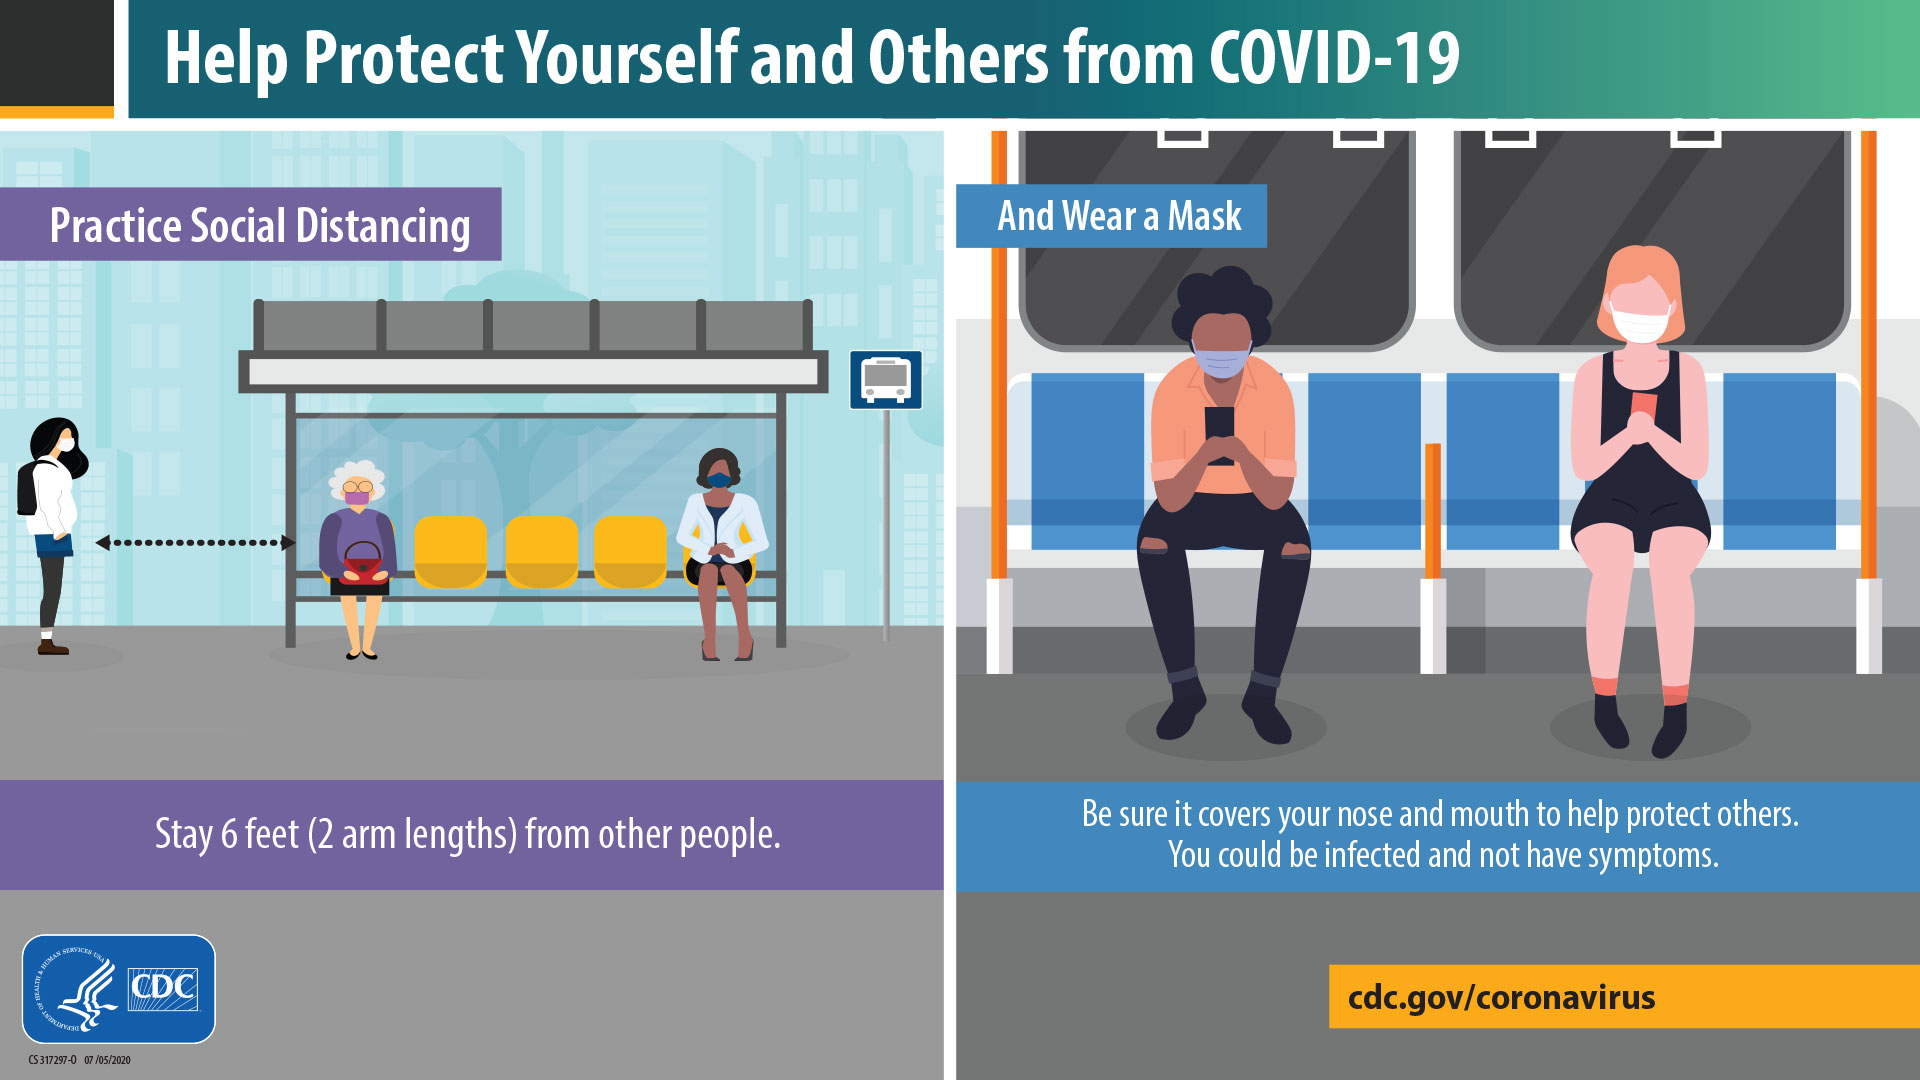
Specificity makes these images perfect for telling stories in which those actions apply, and even though each figure has a particular hair, skin color or gender identity, it’s the action that the reader will connect with.
Below we see another example of how this style can bring a story to life.

Here’s another example of how you can use this style of people icons in your infographic. Note that the illustrations here, though still heavily stylized, do not come with background images like the ones above:
![]()
In some cases, drawn figures that aren’t highly stylized or detailed are also effective at bringing in the human touch.
![]()
The images above, for example, show people in recognizable poses, and the lack of facial details means the viewer will focus on the action the figure is doing rather than what their face looks like.

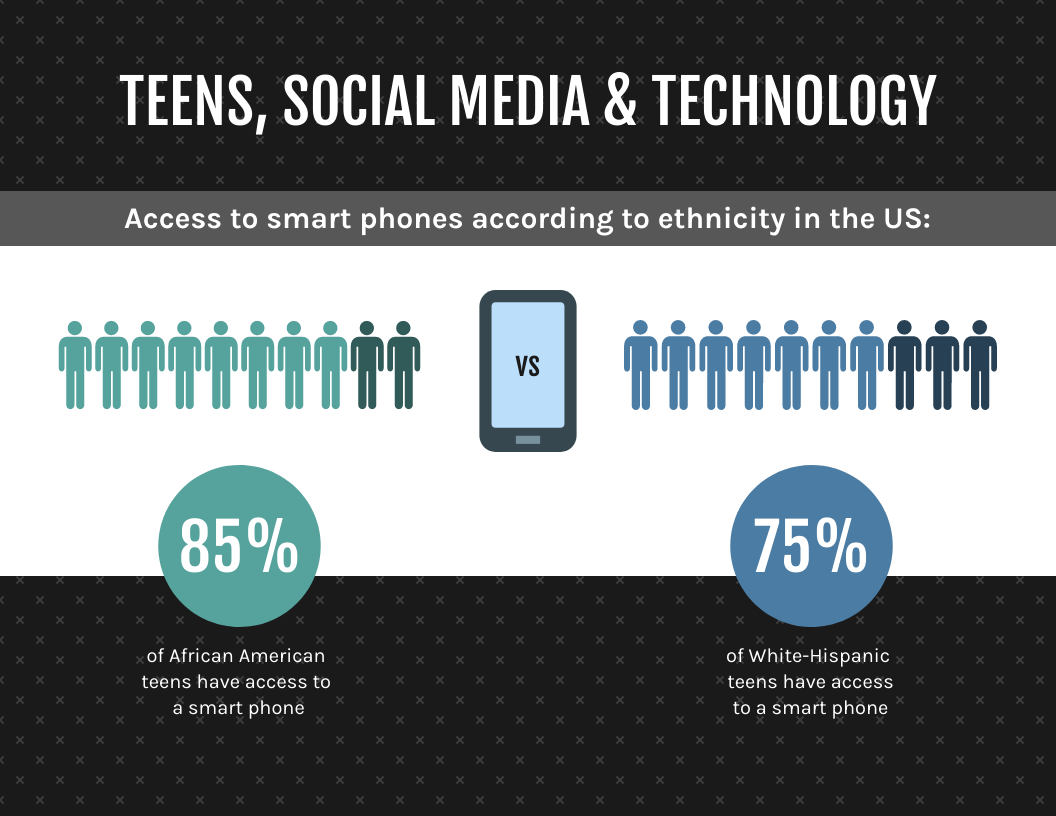
In the above example, we see how simple, faceless illustrations of people can bring a story to life, but illustrations in which figures have faces can help bring a spirit of enthusiasm to a people infographic.
![]()
This style offers diversity across sizes, races, genders, religions, ages and more, and the addition of simple facial features clearly conveys emotions that may be absent in the anonymous-looking examples we’ve seen so far.
Venngage has 400+ diverse icons and illustrations of people and you can change the skin color of many of them. Our icons of people are truly representative.

This people icon style is applied to a list infographic that provides tips for being a successful business owner, as can be seen below. The character chosen serves as a stand-in for the image of a modern entrepreneur, who is usually young, which we see in his grooming and clothes.

The infographic below describes the four types of donors and uses full-body people icons to represent them:

Most of the characters we’ve explored so far have been depicted in full-body images, but we know that faces have a huge visual impact thanks to the way the brain works. Illustrations that focus on faces can also generate an emotional impact.
Just like with the full-body people icons and illustrations, you can change the skin color for these people icons as well, using Venngage’s Infographic Maker.
![]()
These faces, for example, are rendered in a style similar to our entrepreneur, but by zooming in to just the faces, the reader sees more than the broad strokes of what these characters represent.

This example, which uses an illustrated infographic style to share key information in an employee handbook, is undeniably upbeat and energetic thanks to the pastel-heavy color palette and friendly illustrations.
Imagery that connects to people is often even simpler than what we’ve seen so far. Icons, pictograms, silhouettes and other simple illustrations all serve to provide a shorthand to readers that the information they’re seeing applies to people just like them.
The human pictograms in the above infographic are the quintessential application of icon-based imagery that stands in for people. If this example were to have more detailed illustrations, the reader might be distracted. In this case, the clinical approach is best.
Best practices for people infographics
How can you bring people data to life in the best way? There are a few tips and tricks to making the most of the people infographic format:
- Know when to be detailed
If your readers might become distracted by small details in your people illustrations (or photographs), consider using flat icons or pictograms instead.
- Be mindful of cultural implications
Other-ism and token-ism are examples of how oppression can be reinforced by seemingly innocuous design choices. Especially when using illustrations with very little detail, exclusion can be baked in.

Consider the pictogram image that’s become a stand-in for humans, seen in this example. That image itself is based on assumptions that can create a feeling of exclusion based on body size, shape, clothing and more.
However, it’s also important to avoid token-ism, which is the term for a weak gesture toward diversity, such as including an illustration that has one person of color amid many others who are white.
Being thoughtful and balanced in your choice of illustrations in people infographics adds nuance and detail that shows you understand the importance of diversity and inclusion.
Related: 8 Best Practices for Designing Infographics for Diversity and Inclusion
- When using photographs, keep image resolution in mind
Most modern photography equipment will do the trick, even smartphones. For online publications, 150ppi resolution is sufficient, but if your infographic is going to be printed, images should be 300ppi.
- Mix it up
Just because your primary illustration method includes icons or photographs of people, that doesn’t mean you can’t include more traditional data visualization. This infographic uses both people icons and other types of data visualization to tell the story.

Giving your infographic a personal touch can make the data hit home more effectively than with data visualization alone
Especially when dealing with information that can lend itself to data visualization, it’s easy to get lost in the numbers and forget that most stories we’re telling have a human side.
That’s why telling a data story through a people infographic is the ideal way to bridge that divide, letting you ground your story in reality and boost the emotional impact it can have.
With many possible image types, including photography and illustrations, a people infographic format can be used to tell just about any type of story. Ready to give your infographics a human touch? Start working with Venngage’s Infographic Maker, which features more than 400 customizable icons and people illustrations.


