


Graphs aren’t just for grumbling teens in a math class, or for people who work with numbers. A graph can be used for many reasons— you could be a student working on an assignment, a manager writing your monthly report, an event planner trying to measure the success rate of your event, or maybe even a medical expert who studies how well certain medications work on different people.
A graph or chart typically presents the relationship between the variables in a data in a visually organized manner. For example, if you would like to compare the number of people who prefer chunky peanut butter vs smooth peanut butter, you could use a chart to easily do this.
A picture is worth a thousand words (or, in our case, numbers).
Greg Harvey, “Microsoft Office Excel 2007 All-in-One Desk Reference For Dummies”
Whether you’re looking to create a chart for your homework or next work report, we’re happy to tell you that you can create a chart by using many tools (without paper and pencils): Microsoft Word, Google Docs, Microsoft Powerpoint, and more. As of February 2024, Google’s office suite controlled over 44% of the global market share for major office suite technologies, while Microsoft’s Office 365 held 30%.
In this step by step, comprehensive guide, we’ll walk you through how you can create a graph using Microsoft Word, and how you can make it all hassle-free by using a free online graph maker or a free and editable graph template.
Click to jump ahead
- Step by step guide for creating a graph on Google Docs
- How to make a graph in Venngage?
- A final note: creating a graph using Google Docs vs Venngage
Step by step guide for creating a graph on Microsoft Word
To create a Graph in Microsoft Word, you can do the following steps:
- Step 1: Open Microsoft Word
- Step 2: Insert a graph
- Step 3: Choose the type of graph
- Step 4: Enter your data
- Step 5: Customize the graph
- Step 6: Add titles and labels
- Step 7: Final adjustments
- Step 8: Save your document
Let’s dive deeper with a step-by-step explanation to help you create a graph easily by using Microsoft Word.
Step 1: Open Microsoft Word
To start making your graph, you will first need to locate and open Microsoft Word. If you already have it installed on your laptop, then all you need to do is open the program. If you are using Windows, you will find it in the start menu. On a MacOS, you can find it at your launchpad.
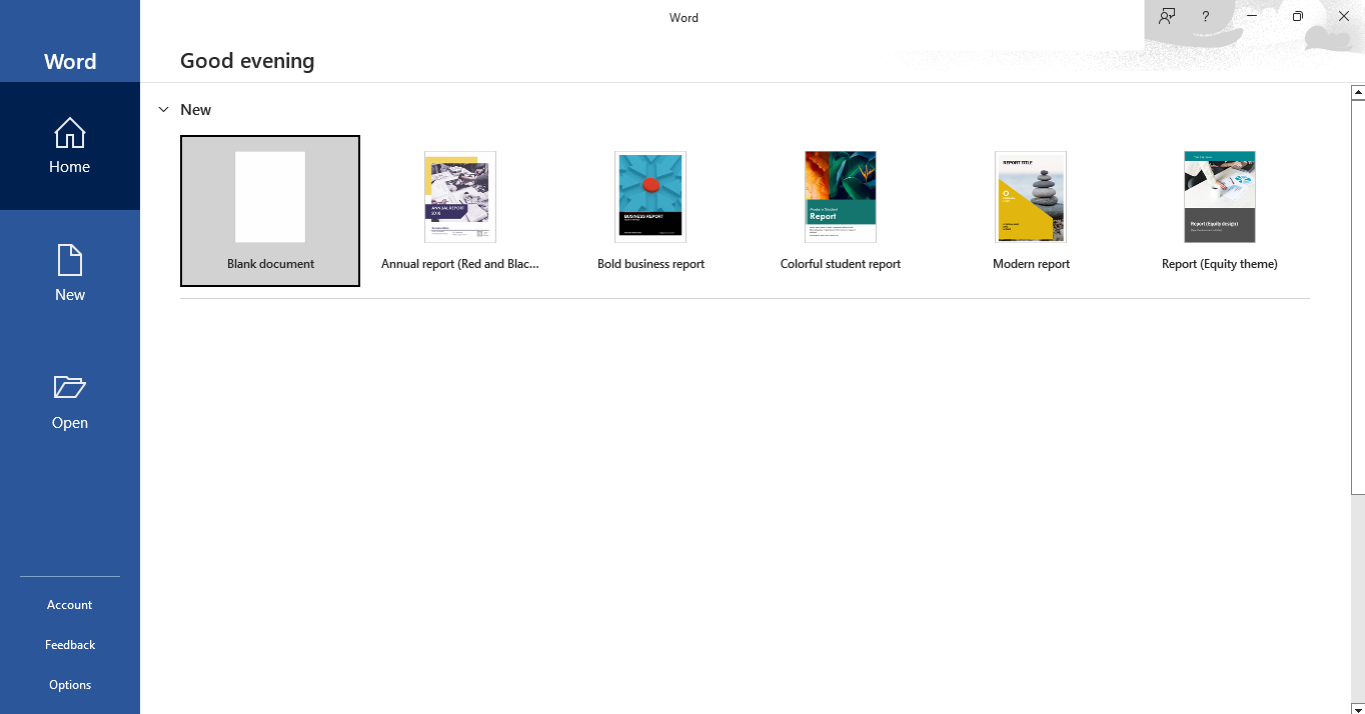
1. Open the program:
- Launch Microsoft Word by double-clicking on its icon or searching for it in the Start menu.
2. Create a new document:
- Click on “Blank Document” to start a new project.
Step 2: Insert a graph
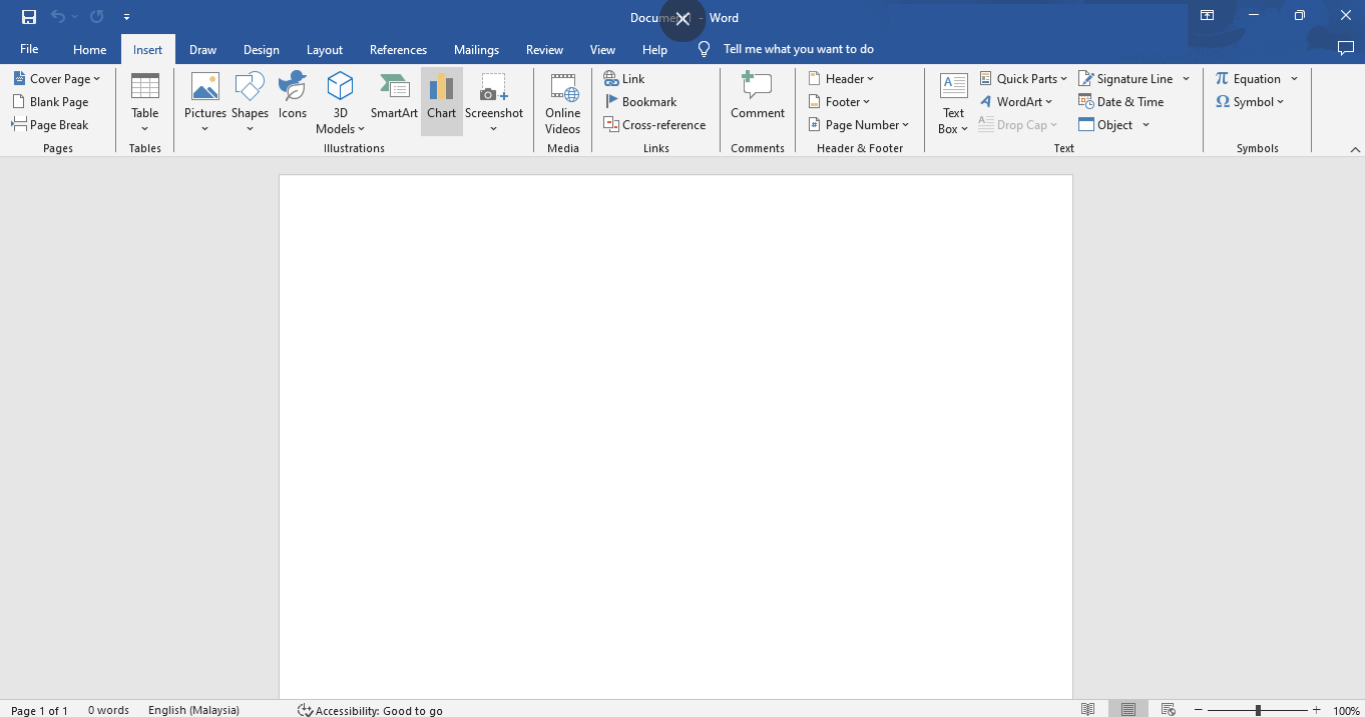
After you click on ‘Blank document’, word will open a new document for you. Now you can directly start making your graph by inserting it into your work.
- At the top of the Word window, click on the “Insert” tab.
2. Select chart:
- In the Insert tab, find the “Chart” button in the Illustrations group and click on it.
Step 3: Choose the type of graph
There are many types of graph, e.g. column, bar, pie, line, and more. Among them, bar charts, line graphs, pie charts and histograms are the most widely used in business and education. Choosing the right type of graph is key to presenting your data clearly and accurately. Once you’ve identified the best option for your needs, you can insert it into your document with ease.
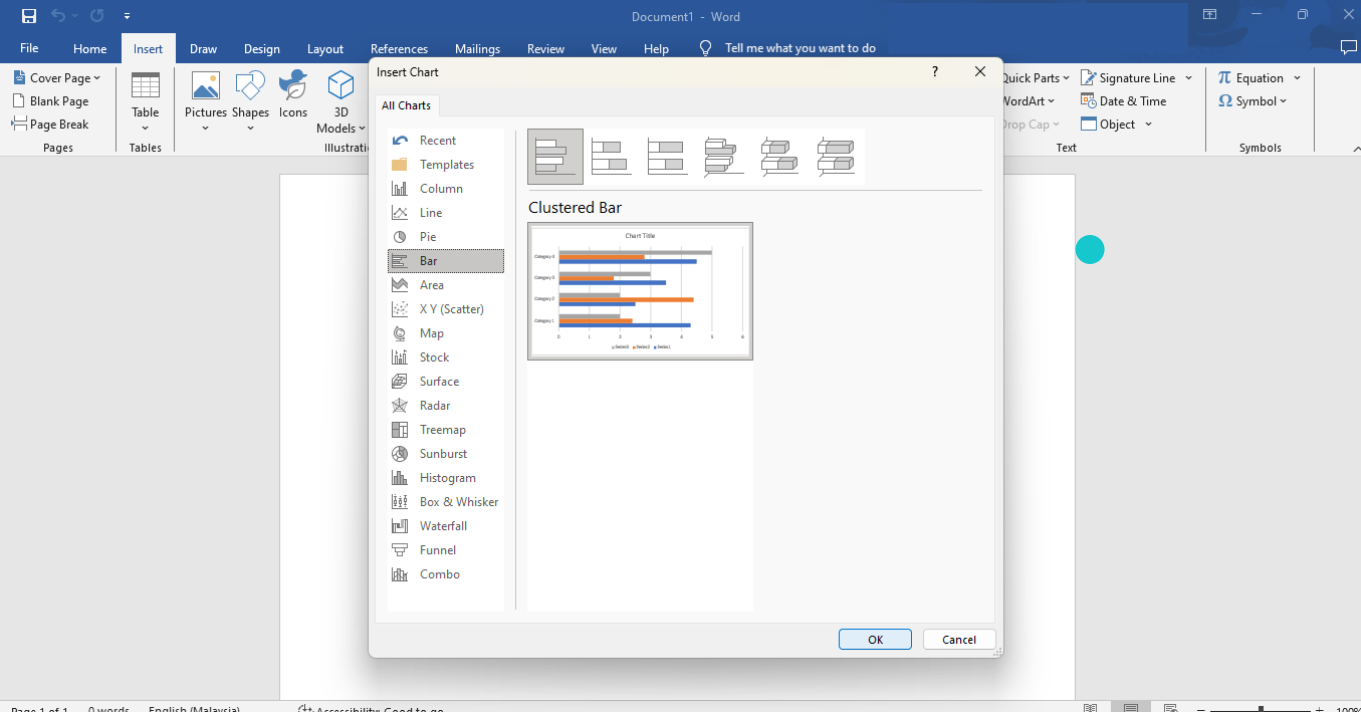
1. Chart selection window:
- A new window will appear with various chart types.
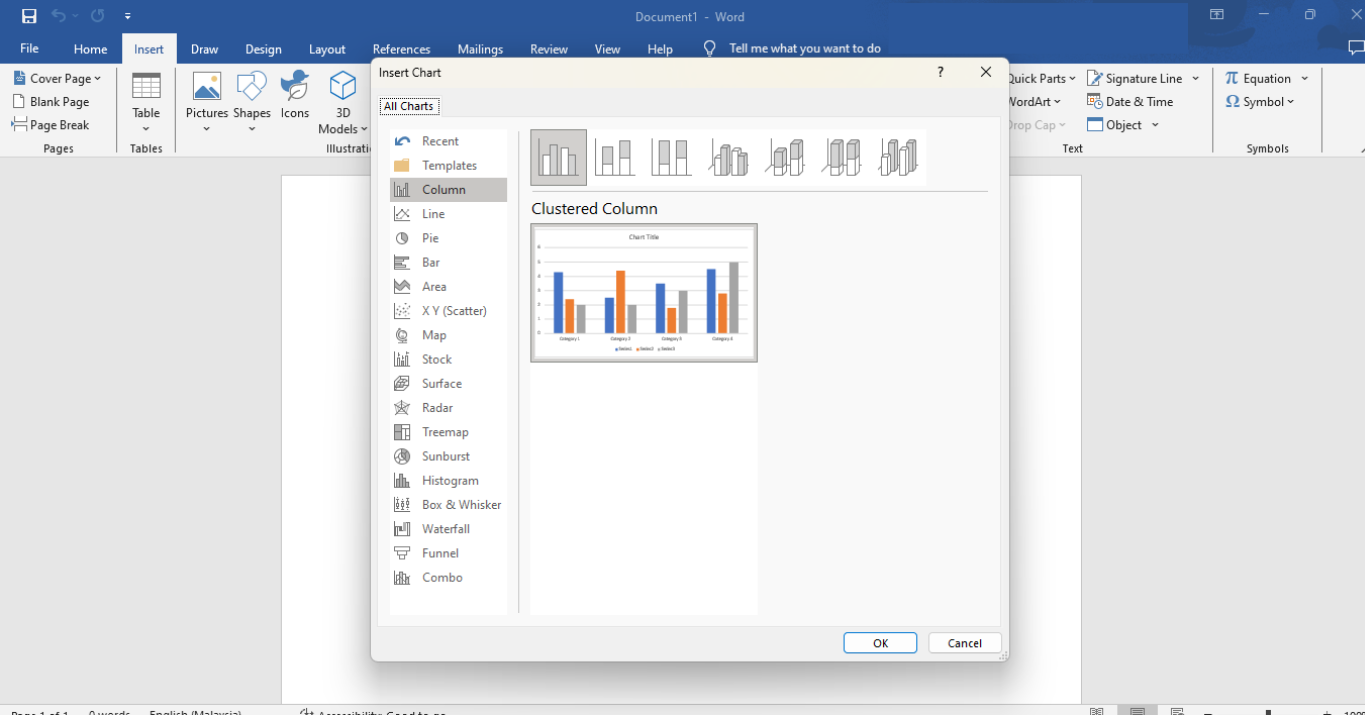
2. Select a Graph Type:
- Choose the type of graph you need (e.g., column, line, pie, bar, etc.) from the list on the left.
3. Click OK:
- Once you have selected your graph type, click “OK.”
Step 4: Enter your data
After choosing your chart or graph, Word automatically opens an Excel sheet where you can enter your data to build it. Around 80% of small and medium-sized enterprises (SMEs) rely on Microsoft Office products, either as standalone apps or through Microsoft 365.
1. Excel Sheet Open:
- An Excel sheet will open within Word, allowing you to enter your data.
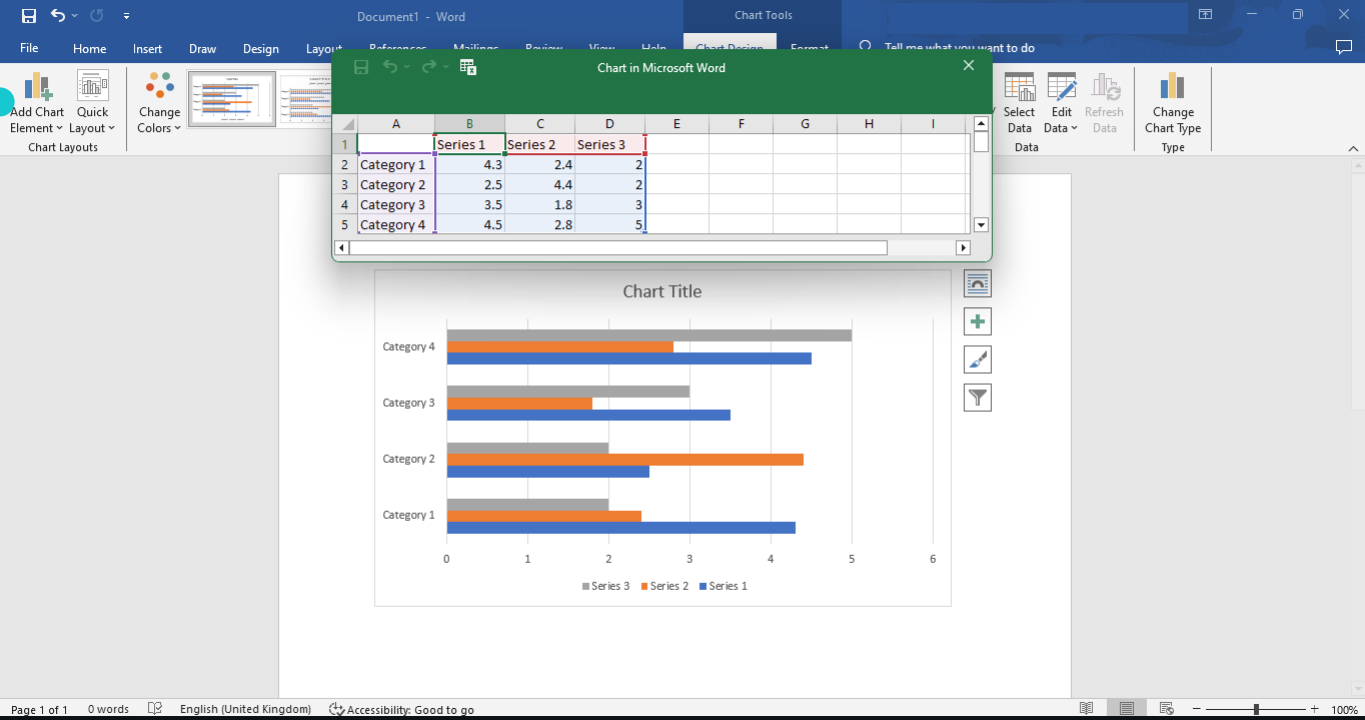
2. Input data:
- Enter your data into the Excel sheet. You can modify the existing data or add new rows and columns as needed.
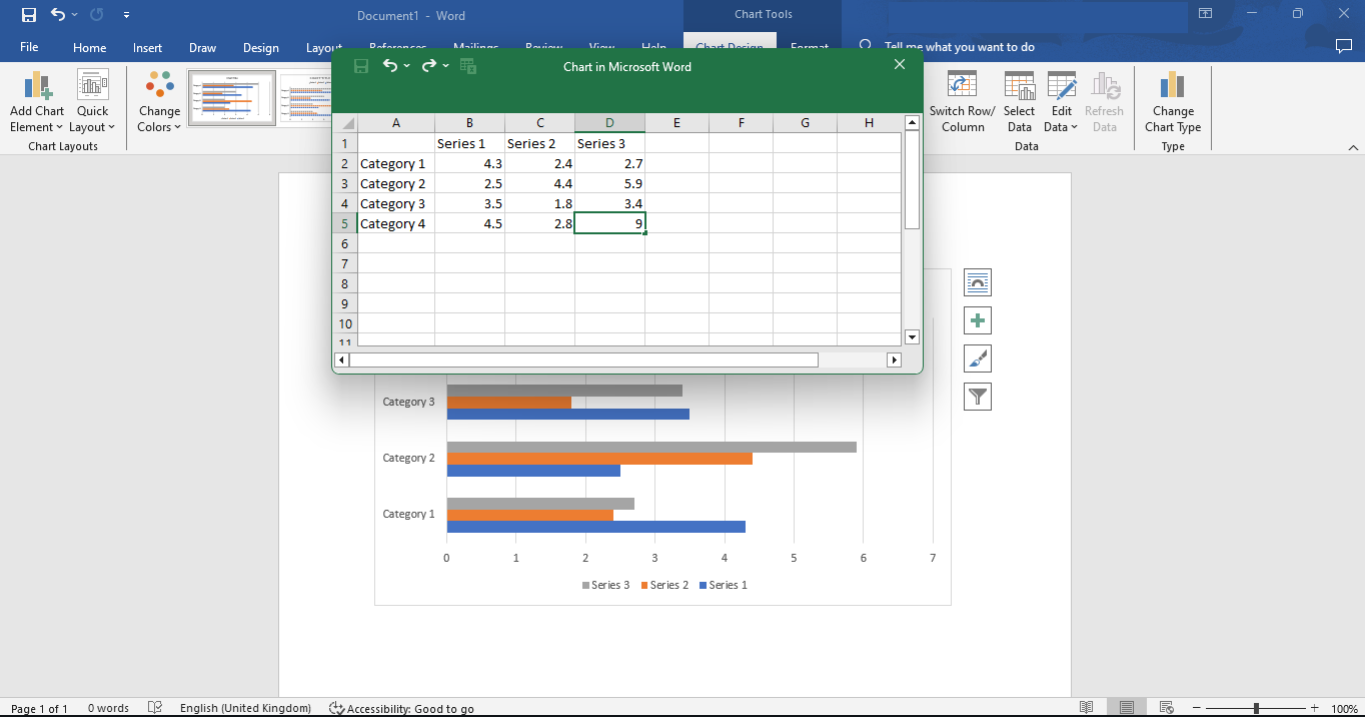
3. Close Excel Sheet:
- Close the Excel sheet after entering your data. The graph in Word will update automatically to reflect the changes.
Step 5: Customize the graph
After you’ve finalized your data, you can now customize your graph. Here, you will be using ‘Chart Tools’ to help you do so.
1. Select the graph:
- Click on the graph in your Word document to select it.
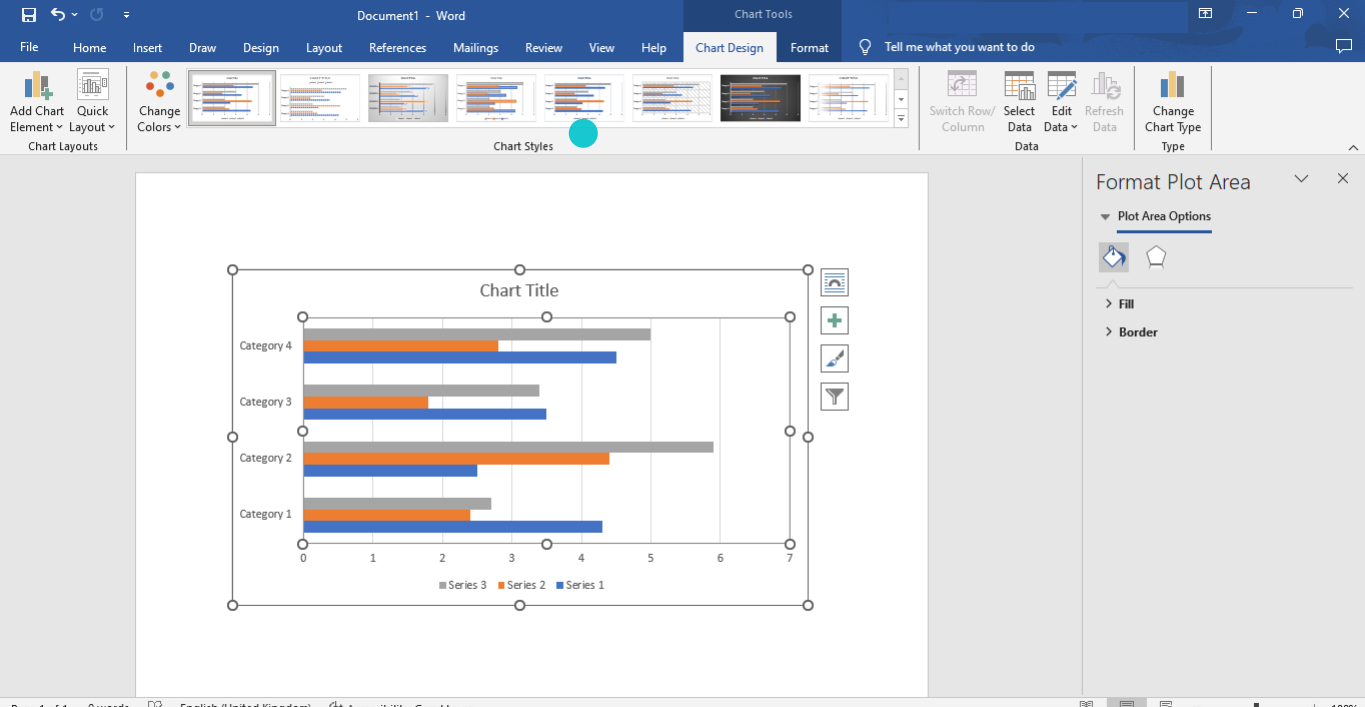
2. Use Chart Tools:
- Design Tab: Use this tab to change the chart style, switch rows and columns, or select a different chart type.
- Format Tab: Use this tab to adjust the chart’s appearance, such as changing colors, fonts, and other formatting option
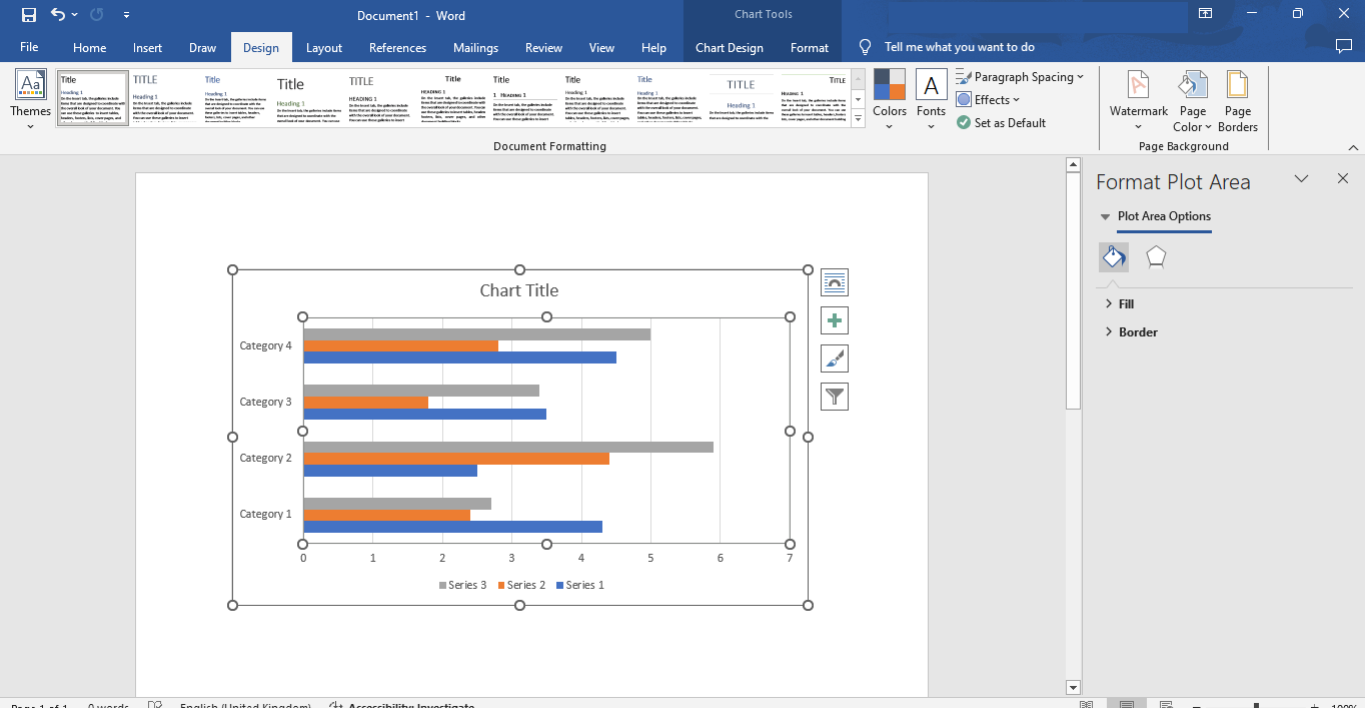
Step 6: Add titles and labels
Customizing your graph is one thing, but it is also important to make it more readable. For better clarity, you will need to add titles and labels to your chart.
1. Chart elements:
- Click on the “+” icon next to the graph to open the “Chart Elements” menu.
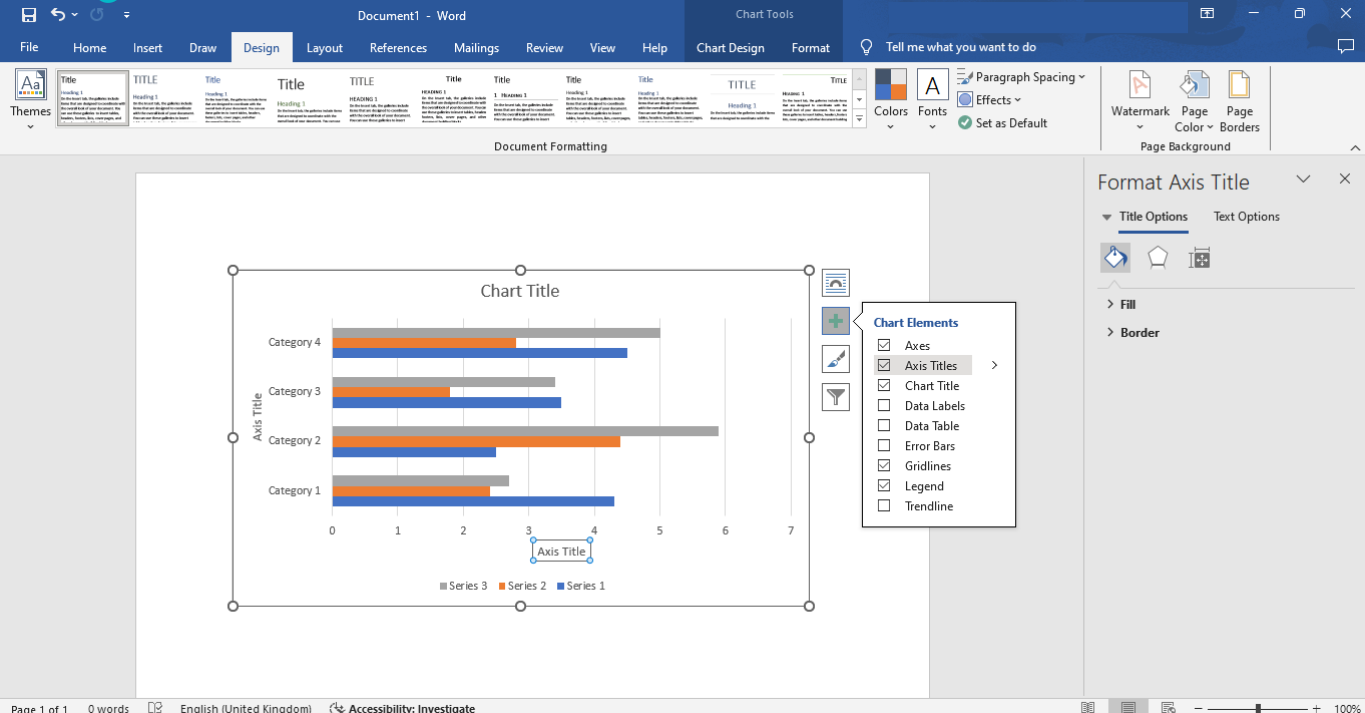
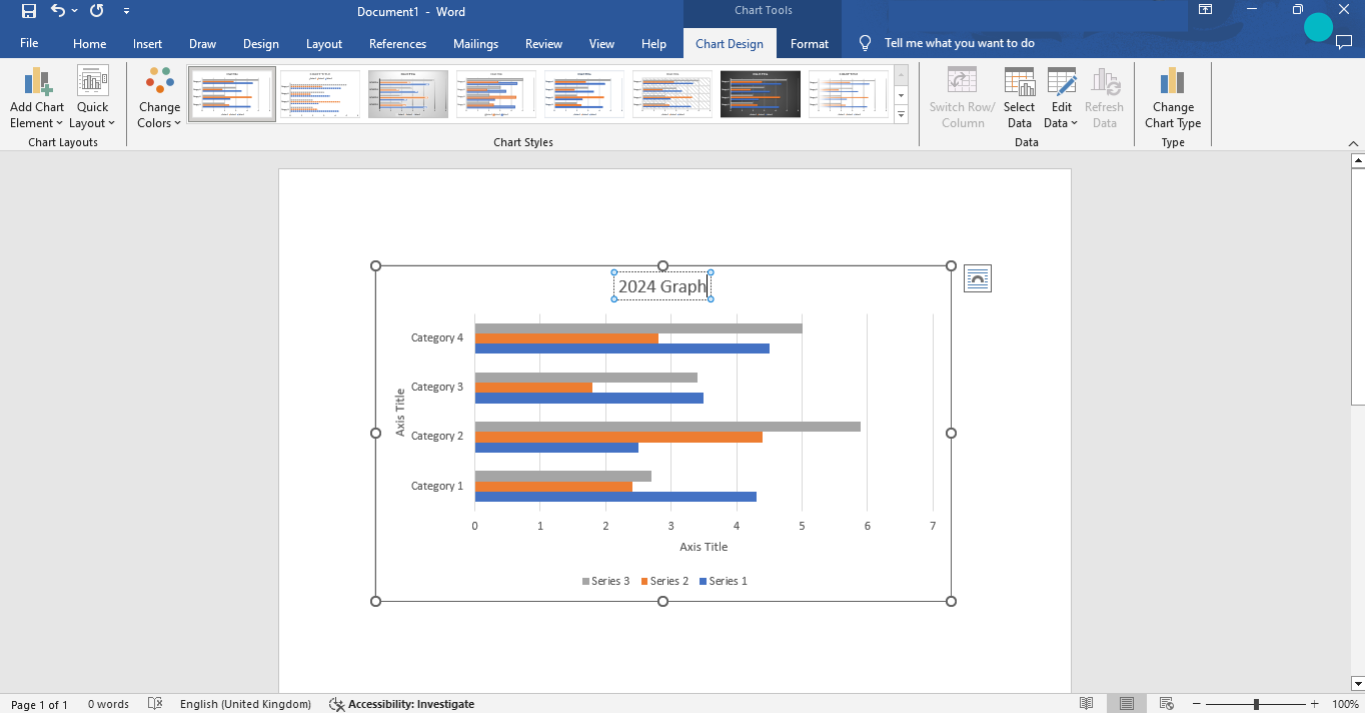
2. Add chart titles:
- Check the “Chart Title” box and click on it to add a title to your graph. Type in your desired title.
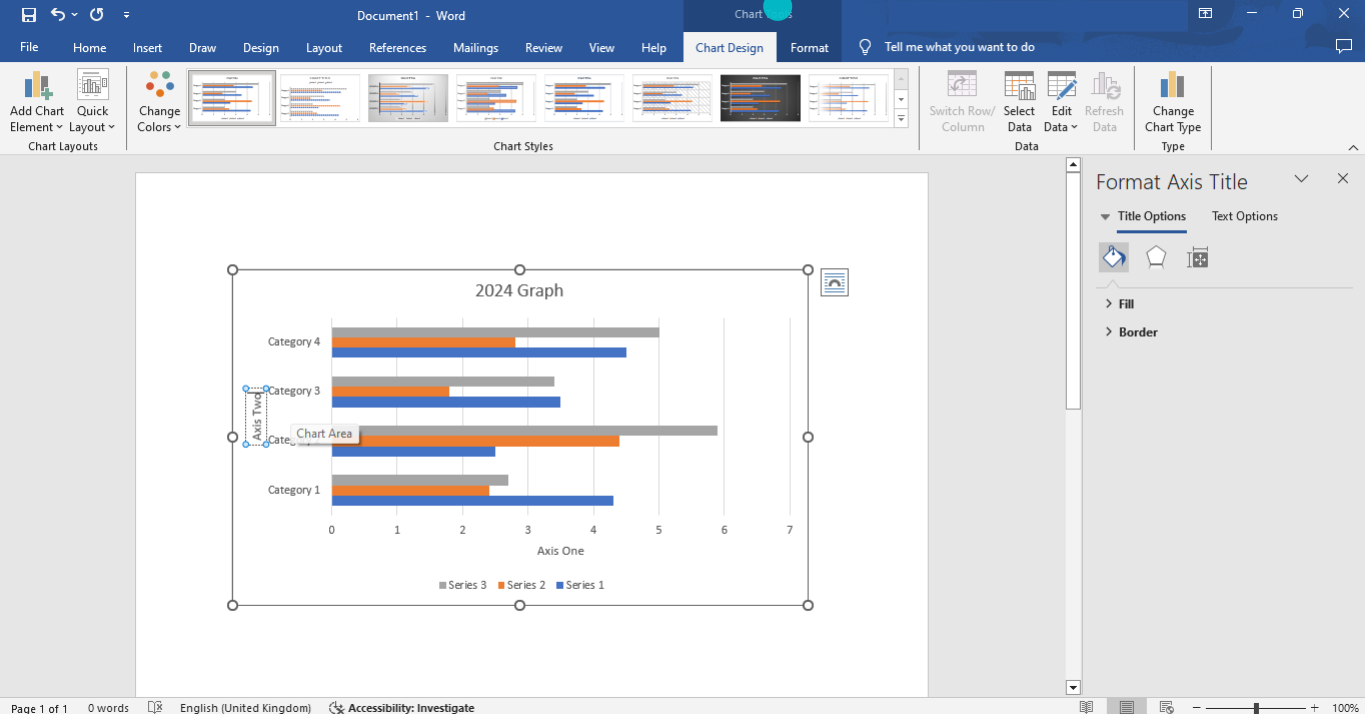
3. Axis titles:
- Check the “Axis Titles” box to add labels to the horizontal and vertical axes. Click on each axis title to edit the text.
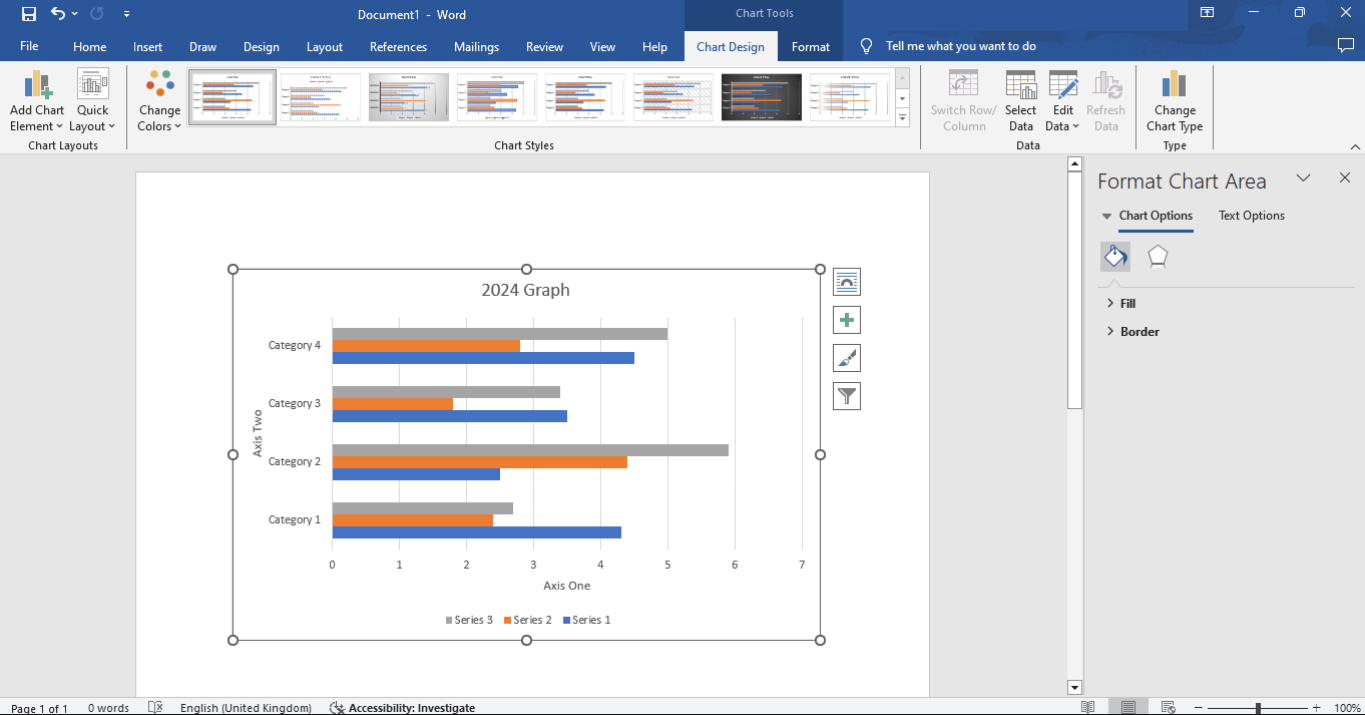
Step 7: Final adjustments
You’re almost done with your graph. You’ve customized, and added titles and labels. Now all you have to do is make some final adjustment, and review all the information in your chart before you can save and share your work.
1. Resize the graph:
- Click and drag the corners of the graph to resize it.
2. Position the graph:
- Click and drag the graph to move it to your desired location within the document.
3. Check for accuracy:
- Ensure that all data, titles, and labels are accurate and clearly displayed.
Step 8: Save your document
Your final graph is now done. Once again, make sure that you have ensured the accuracy of your data. If you have, you can now save and export your work to be used anywhere.
1. Save the File:
- Click on the “File” tab and select “Save” or “Save As.”
2. Choose Location:
- Choose the location where you want to save your document.
3. Name Your File
- Enter a name for your document and click “Save.”
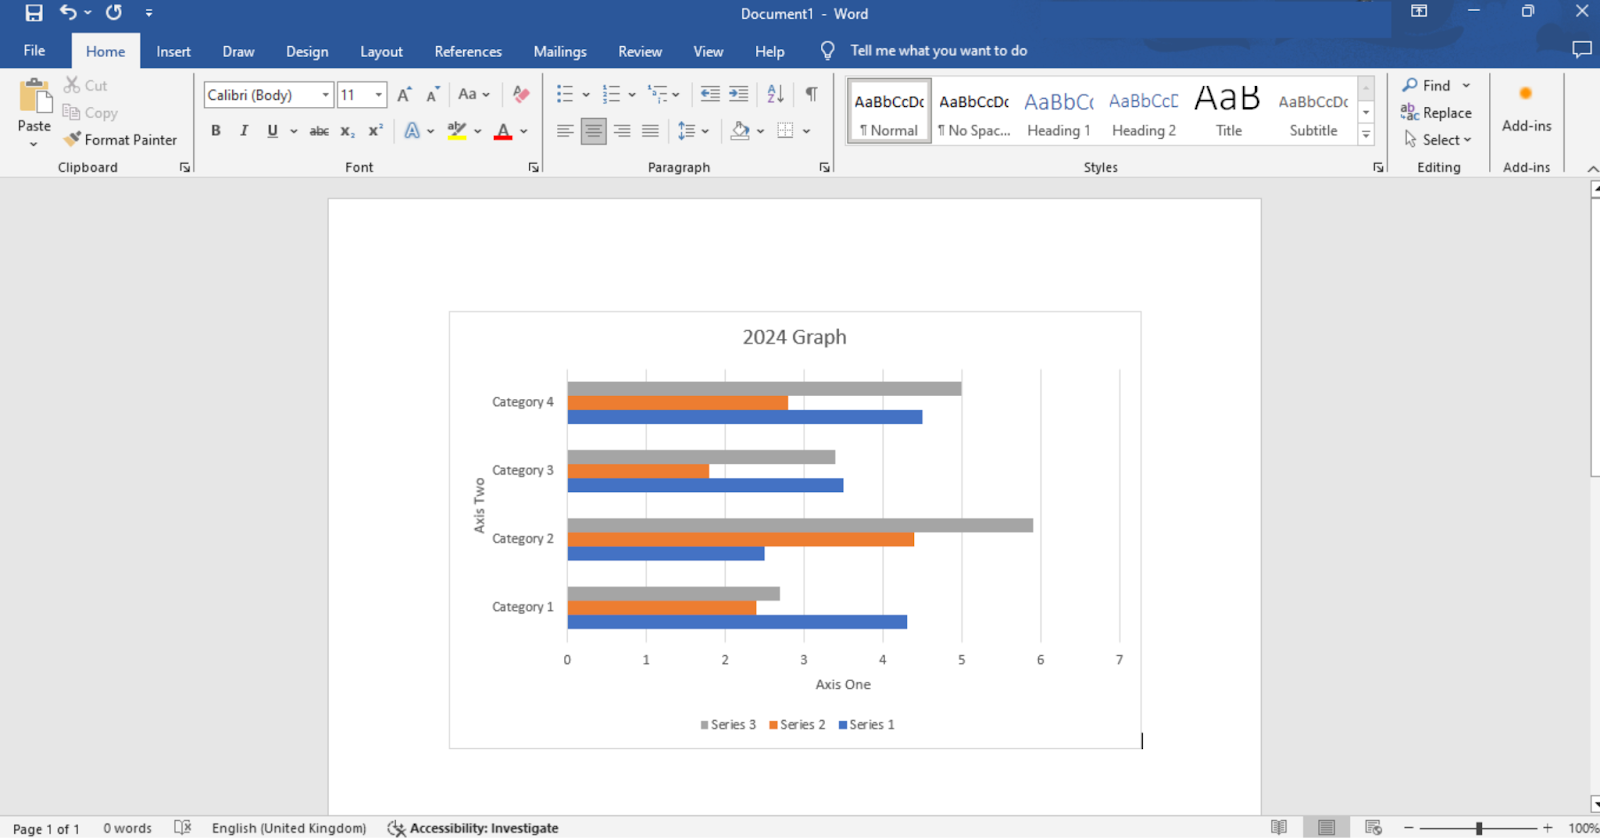
And here is your final graph!
How to make a graph in Venngage?
We’re sure that with our step-by-step guide to creating a graph on Microsoft Word, and a little practice, you will be able to create a graph for your next work easily. But, what happens if you need a graph quickly, or if you need to customize the design of your graph better to make it more presentable and easy to read, or simply to reflect your company’s branding?
This is where an online free graph maker comes in. You can use digital designing tools, like Venngage, that provides an online graph maker to help you create a graph quickly and easily. An online graph maker can also offer you the flexibility to design your graph according to the visual branding that you need, and has more easy tools to speed up the process of making a chart.
To start creating, go to Venggage and sign up for a free account. Having an account will help you track the progress of your work easier, and you will be able to return to your design project at any time to review and adjust your graph. Saving and exporting is also much easier when you have a free account.
Then, you can click on this link to start making your graph. It’s that simple. Alternatively, if you don’t prefer starting from scratch, Venngage also provides an abundance of free and editable graph templates. Simply choose one that would work best for you, and you can begin designing. It’s really that simple!
Not sure which template to go with? Don’t worry, here are some suggestions for you:


Want even more options? Check out this roundup of the top free graph makers that actually make data visualization simple.
A final note: Creating a graph using Microsoft Word vs Venngage
Needing a graph is more common than you think. As we have explored, you can use a graph or chart for almost anything, as it helps to visually present complicated data and its relationships better.
If you need to make a graph, you can certainly use programs or tools like Microsoft Word, Microsoft Powerpoint, Google Docs or even Google Slides to help you create one from scratch. However, using Microsoft Word to create your graph or chart comes with a few limitations.
If you’re looking for customization, design flexibility, and an easier way to make your graph, then it would be better for you to use a digital designing platform that provides a free online graph maker.
By using this, you will be able to design your graph without much restrictions, and if you are choosing from one of their many, readily available free graph templates, you can even design a unique chart type that you may not be able to insert using Microsoft Word.
Good luck with your graph creating adventures!


