


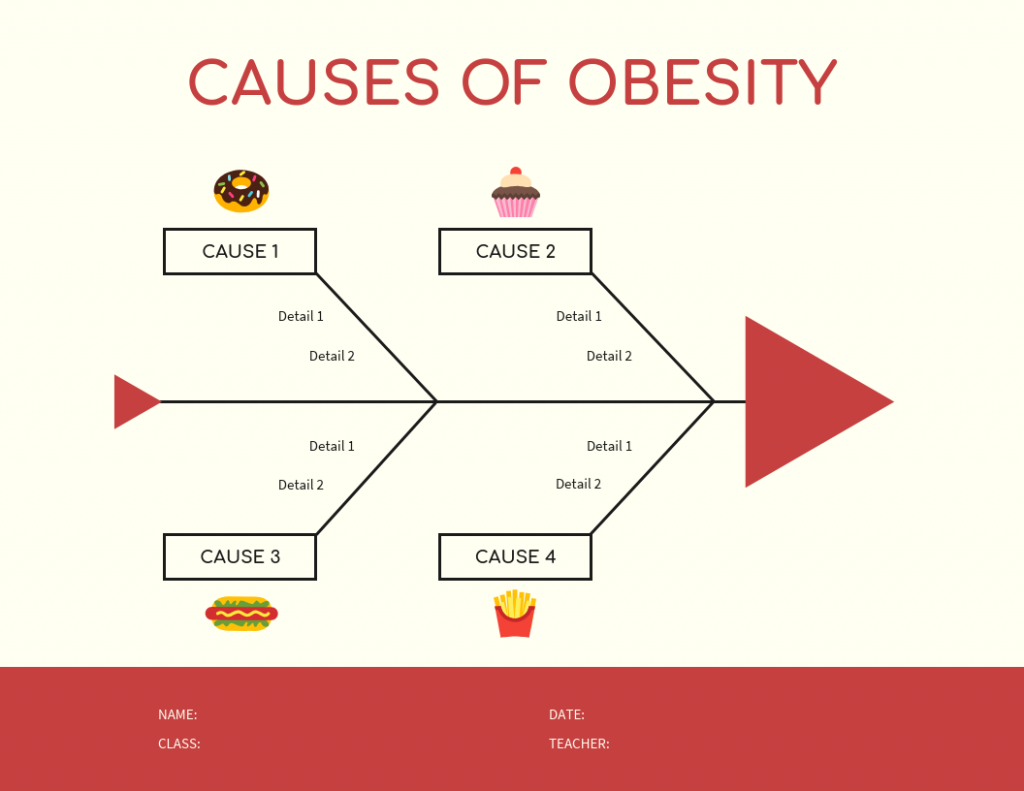
The fishbone diagram, often referred to as the Ishikawa diagram or cause and effect diagram, is a powerful visualization tool that elucidates the intricate web of contributing factors behind a specific problem or issue. Characterized by its unique bone structure, it places the problem statement at the fish’s head, branching out to the various causes categorized into major segments.
The primary purpose of a fishbone diagram is to break down complex problems into understandable components, enabling team members to efficiently brainstorm and analyze causal relationships, making it indispensable in areas like quality management and root cause analysis.
Whether you’re aiming to delve deep into the causes of climate change or dissect the factors behind a the fishbone diagram provides a clear visual representation, highlighting the cause and effect relationship and underscoring the value of systematic problem solving.
For those eager to harness the potential of this great tool, Venngage offers a robust diagram maker. With customizable fishbone diagram templates, it empowers users to craft their diagrams effortlessly. These templates are meticulously designed to help you place ideas in the appropriate category, ensuring a comprehensive and organized cause and effect analysis.
Click to jump ahead:
- Root cause fishbone diagram example
- Cause and effect fishbone diagram example
- Ishikawa fishbone diagram example
- Medical fishbone diagram example
- Climate fishbone diagram example
- Project management fishbone diagram example
- Simple fishbone diagram example
- How to use a fishbone diagram?
- In summary
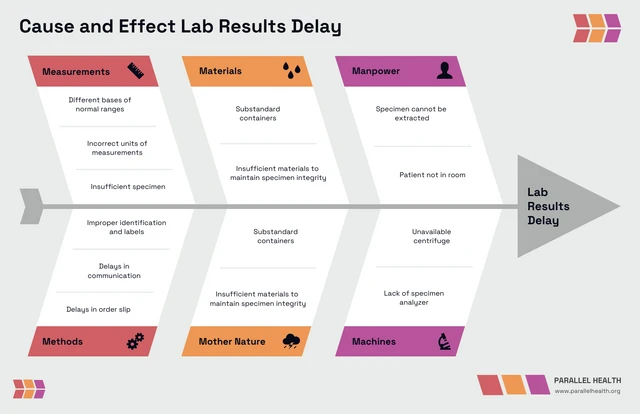
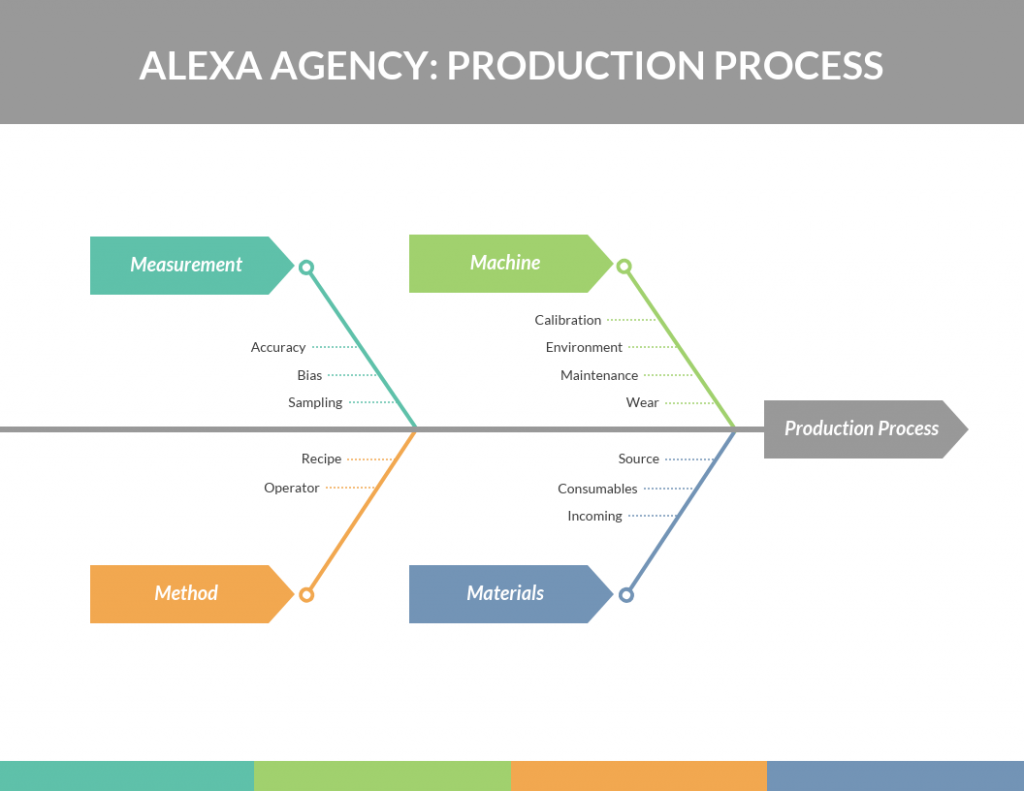
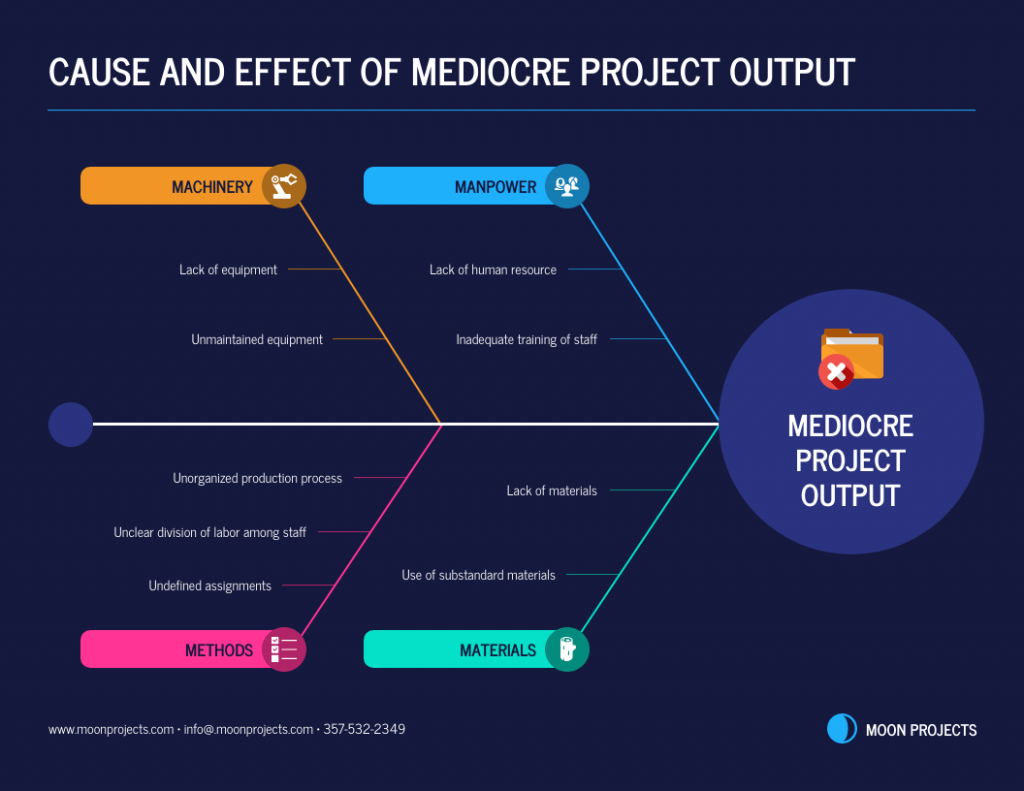
Root cause fishbone diagram example
A root cause fishbone diagram, at its core, is a tool specifically tailored to identify, analyze and represent the underlying causes or root causes of a problem. Imagine a scenario where a manufacturing process has a recurring defect.
In such a scenario, the problem statement or defect would be placed at the fish’s head. As one begins the fishbone analysis, the spine of the fish represents the main flow of the process, with smaller bones branching out. Each of these bones corresponds to a contributing factor or potential cause of the defect.
Utilizing the fishbone diagram for root cause analysis involves gathering team members for a brainstorming session. Here, the group would identify various major categories like “Machinery”, “Manpower”, “Materials”, “Methods”, etc.
Under each of these categories, multiple factors are explored. For instance, under “Machinery”, potential causes could include outdated equipment, calibration errors or frequent breakdowns. The aim is to determine the root cause, or in some cases, multiple root causes, responsible for the defect.
The visual representation afforded by the diagram aids in systematically breaking down the problem, ensuring no stone is left unturned.
One of the advantages of using a root cause fishbone diagram is its ability to pinpoint areas that might otherwise be overlooked. It offers a structured approach, helping teams avoid short-term fixes and instead address the deeper, underlying issues. However, it’s crucial to be aware of its disadvantages too.
The success of the diagram heavily relies on the expertise and insights of the team members. If not all possible causes are considered, the analysis may be incomplete, leading to erroneous conclusions.
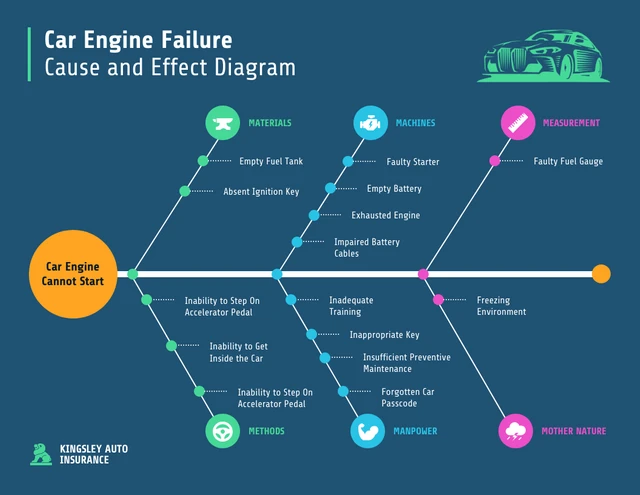
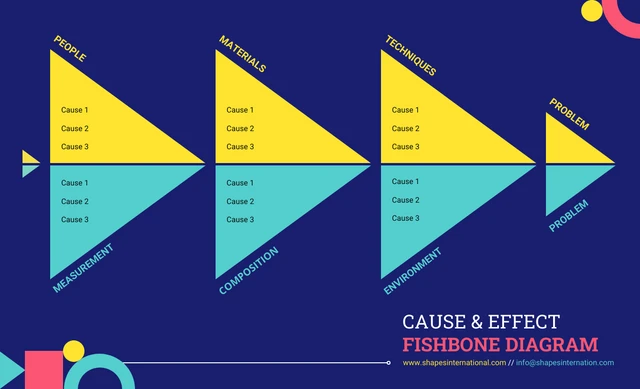
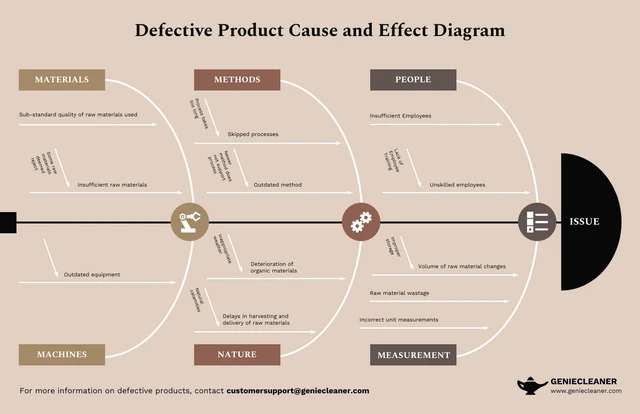
Cause and effect fishbone diagram example
The cause and effect fishbone diagram is primarily used to map out the various causes contributing to a specific effect or outcome. For instance, consider a problem statement like “Decreased Sales in Quarter 3”.
Placed at the head of the fish, this statement becomes the focal point of the analysis. The spine extends outwards, branching into multiple categories that could be influencing this decline.
Starting with a brainstorming session, team members can identify major categories such as “Marketing”, “Product Quality”, “External Factors”, and “Customer Service”. Under “Marketing”, for example, potential causes could be insufficient advertising, poor social media engagement, or ineffective promotional campaigns.
The aim is to capture all the possible causes contributing to the decline in sales. Through the fishbone diagram’s structured format, teams can effectively map out the causal relationships, understanding how various factors interplay and lead to the overarching problem.
Using the cause and effect fishbone diagram offers a comprehensive overview, helping businesses or teams strategize effectively. They can prioritize areas that need urgent attention and develop strategies for improvement.
However, like all tools, it has its disadvantages. It requires thoroughness and can become convoluted if too many minor issues are included. Thus, it’s essential to keep the diagram focused on significant, impactful causes to maintain its efficacy as a problem-solving tool.
Ishikawa fishbone diagram example
The Ishikawa fishbone diagram or just fishbone diagram, named after its creator Kaoru Ishikawa, is a powerful visualization tool designed to map out causal relationships concerning a particular problem or issue. Its unique design, reminiscent of a fish’s skeletal structure, places the primary problem or effect at the fish’s head.
From this focal point, the “spine” of the fish extends, leading to branching “bones.” Each branch represents a category or a group of potential contributing factors that lead to the main problem. Often used in root cause analysis and quality management, the Ishikawa diagram breaks down complex issues by categorizing them into major areas such as “People”, “Processes”, “Environment” and more.
This structure allows for an organized exploration of potential causes, ensuring that various perspectives and elements related to the problem are considered.
By facilitating systematic identification and categorization of causes, the Ishikawa fishbone diagram becomes an essential tool in problem-solving and decision-making processes.
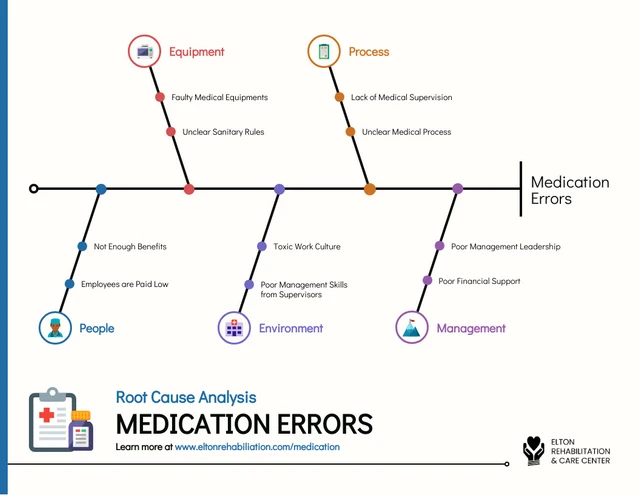
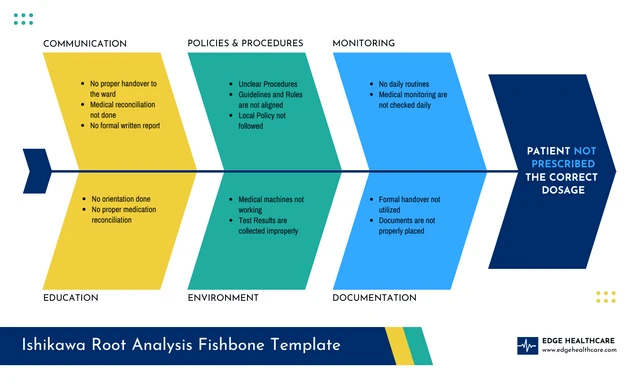
Medical fishbone diagram example
In the medical realm, the fishbone diagram finds a specialized application, offering clinicians a structured format to diagnose and understand patient conditions.
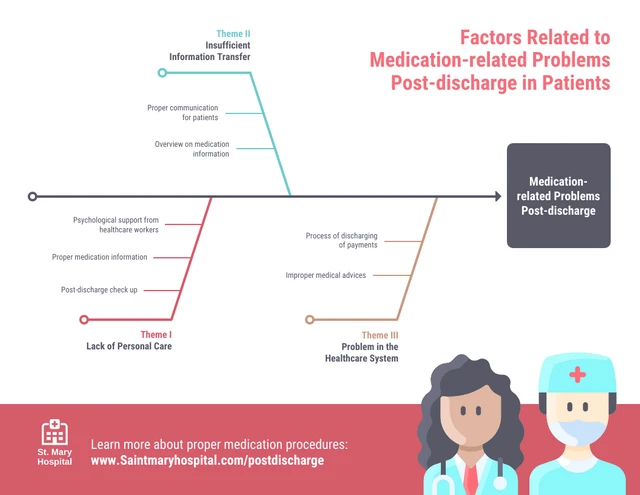
Given the critical nature of healthcare, pinpointing the root causes of medical symptoms or conditions becomes paramount. A medical fishbone diagram aids in this by visualizing potential causes related to a specific medical problem or symptom. Categories in a medical context might include “Laboratory Results”, “Patient History”, “Physical Examination Findings” and “Environmental Factors”.
Under each category, various factors or sub-causes can be listed. For instance, “Laboratory Results” could delve into specifics like electrolyte imbalances or abnormal blood cell counts.
The diagram’s visual representation ensures that healthcare professionals can comprehensively analyze patient conditions, considering multiple facets before determining a diagnosis or treatment plan. This systematic approach fosters enhanced patient care and promotes more accurate diagnostic processes.
Climate fishbone diagram example
Designed for meticulous cause and effect analysis, this fishbone diagram delves into the complex problems associated with climate change. Its visual representation, characteristic of the fish’s skeletal structure, places the overarching problem statement — for instance, “Global Warming” — at the fish’s head. From here, multiple categories branch out, representing major aspects such as “Anthropogenic Activities”, “Natural Causes” and “Economic Factors”.
Each of these major categories further branches out to depict the specific factors contributing to the primary problem.
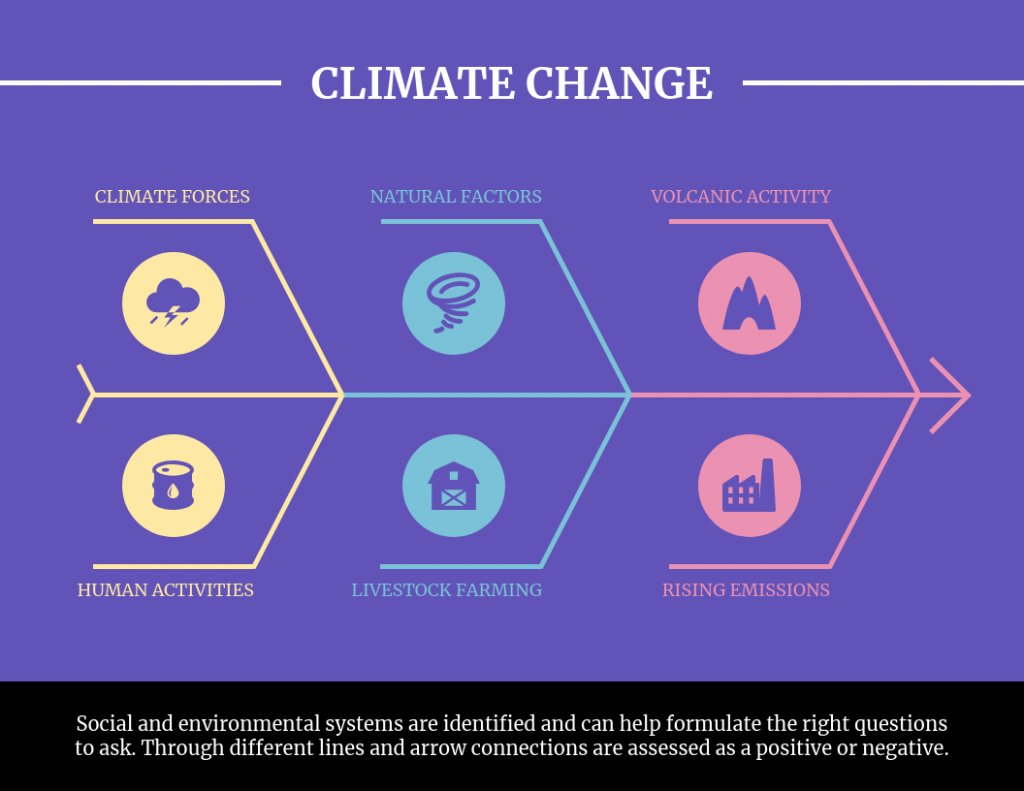
The strength of the climate fishbone diagram lies in its ability to present a comprehensive overview, ensuring that all potential causes, whether they relate to deforestation, industrial emissions, or natural volcanic activities, are captured and analyzed.
It serves as a visualization tool that aids researchers and decision-makers in crafting informed and effective strategies to combat climate-induced challenges.
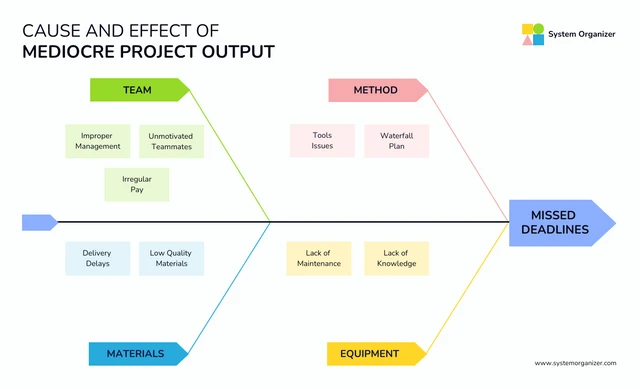
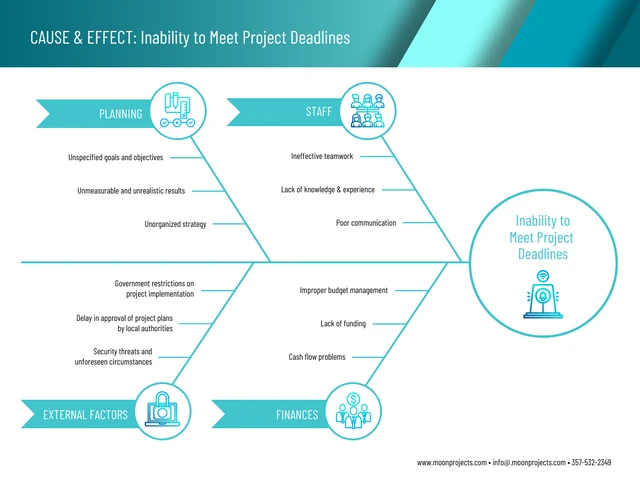
Project management fishbone diagram example
In project management, where precision and systematic problem solving are paramount, the fishbone diagram finds significant utility. Project delays, cost overruns and unmet objectives often have multifaceted root causes.
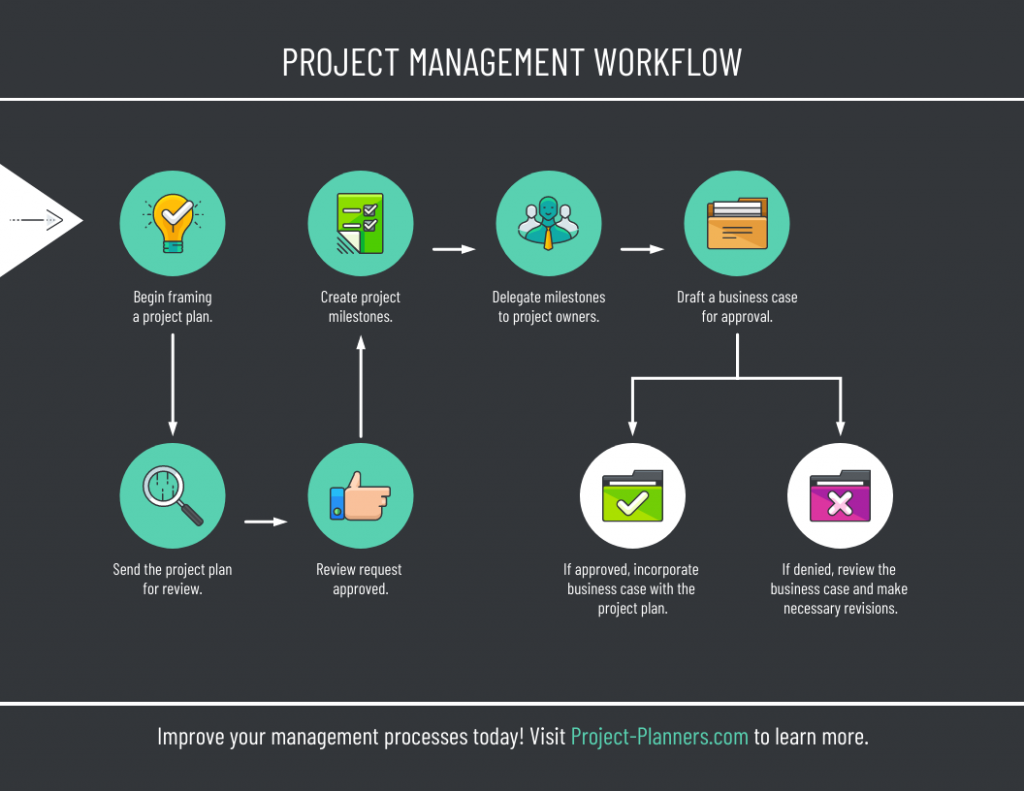
The project management fishbone diagram, an adaptation of the Ishikawa diagram, serves to identify, categorize and analyze these causes.
Each category delineates into specific contributing factors, ensuring a thorough exploration of all potential issues. The visual format of the diagram aids team members during brainstorming sessions, facilitating the identification of challenges within the project lifecycle.
By offering a clear visual representation of the cause and effect relationships inherent in project challenges, the project management fishbone diagram stands as an invaluable tool, helping teams to preemptively address issues, optimize processes and enhance overall project execution.
Related: How to Write a Comprehensive Project Management Plan [+ Examples]
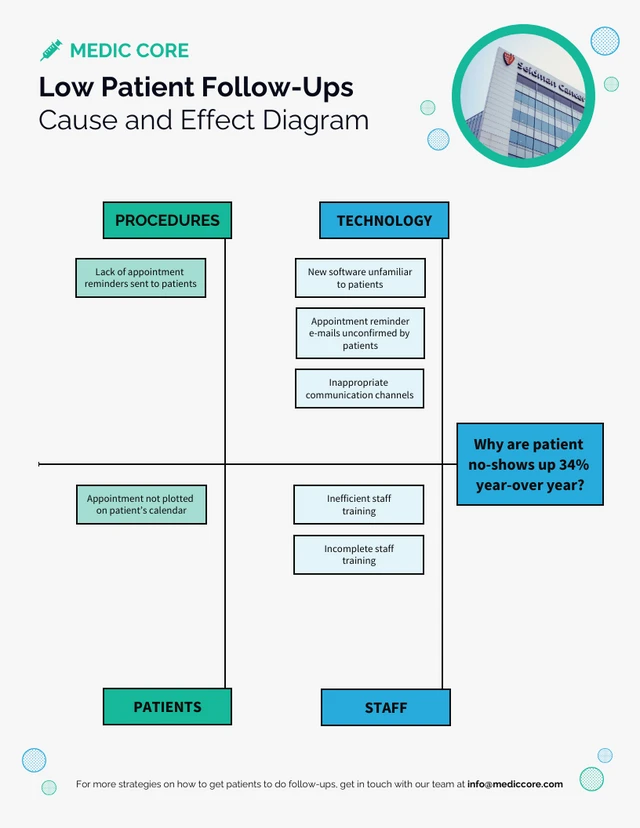
Simple fishbone diagram example
For problems that may not be as intricate but still require structured analysis, a simple fishbone diagram becomes the tool of choice. Stripped of excessive categories and branches, the simple fishbone diagram focuses on presenting the main causes of a problem in a straightforward manner.
Despite its simplicity, the core structure remains consistent: the primary issue or problem statement occupies the fish’s head, while a few major categories branch out from the central spine. This diagram’s strength lies in its accessibility; without delving into overly detailed branches, it offers a clear, concise visualization of the root causes and contributing factors.
It’s particularly beneficial for quick brainstorming sessions or when introducing the concept of cause and effect analysis to those unfamiliar with the fishbone methodology.
The simple fishbone diagram, while not exhaustive, provides a foundational framework, promoting structured thought and problem-solving in various contexts.
How to use a fishbone diagram?
A fishbone diagram, also known as an Ishikawa or cause and effect diagram, provides a visual representation of potential causes leading to a particular problem or effect.
It is a structured brainstorming tool that helps teams identify, explore and visually display the many potential causes related to a specific problem.
- Begin your fishbone diagram with the problem statement or the main effect you’re trying to understand. This is written on the right side and represents the fish’s head.
- Draw a horizontal line extending from the problem statement towards the left. This is the fish’s spine and serves as a foundation for the potential causes.
- Identify the major categories of causes. Common categories include “People”, “Processes”, “Equipment”, “Materials” and others, depending on the context. These are the primary bones branching off the central spine.
- Draw diagonal lines or “fishbones” branching off the spine for each major category.
- Under each major category, brainstorm and list down the potential contributing factors or sub-causes. These represent the smaller bones branching out from the primary bones.
- Connect these sub-causes to the respective major category lines using smaller diagonal lines.
- For causes that may have sub-components or more detailed breakdowns, further branch out from the main cause.
- Make sure to clearly label each cause and sub-cause for clarity.
- After the brainstorming session, analyze the diagram to determine the most likely root causes of the problem.
- Once complete, your fishbone diagram should offer a comprehensive visual overview of all the potential causes leading to the main problem. This structure enables teams to better understand the problem, prioritize potential causes and develop effective solutions or interventions.
Related: 10+ Types of Diagrams and How to Choose the Right One
How to read a fishbone diagram
Now, let’s understand how to read a fishbone diagram for effective cause and effect analysis.
- Start at the head of the diagram: Read the problem statement a couple of times. For example, “Customer churn increased from 8% to 14% in Q2.” This helps you focus on the core business issue, such as rising churn, a product defect, or late deliveries.
- Glance through the bones: Next, skim the main categories of potential causes. If churn is the issue, the bones might include Product, Pricing, Onboarding, Support, and Competitors categories.
- Scan each bone: Work through each bone carefully. Pay special attention to those with many sub-branches — a crowded branch usually flags a key risk area. On the contrary, sparse ones may need more investigation.
- Drill down the sub-bones: Examine each sub-branch to substantiate the cause. Highlight the evidence, including customer feedback, logs, or metrics, to show how the cause leads to the effect. If evidence is weak or missing, mark it for follow-up.
- Analyze patterns across bones: Look for themes that repeat in several categories, such as “inadequate training” appearing under both People and Process bones. These recurring causes often point to the true root and help prioritize the causes.
Fishbone diagrams in Lean & Six Sigma
Fishbone diagrams are commonly used in Six Sigma and Lean processes to visualize possible defects and waste drivers before conducting deeper analysis.
Six Sigma
Six Sigma is a data-driven methodology for reducing process variation and defects. It follows the DMAIC cycle — Define, Measure, Analyze, Improve, Control — and aims for maximum 3.4 defects per million opportunities.
During the Analyze phase, a fishbone diagram helps list every plausible root cause so each one can be tested and either confirmed or ruled out with statistical analysis.
Example: A telecom’s call-center error rate is 5%, well above the 1% Six Sigma target.
- Fishbone head: “Billing errors on 5% of calls.”
- Bones (DMAIC lens):
- People: New hires mis-key data
- Process: Three different billing screens
- Technology: Laggy CRM
- Policies: Frequent promo changes
- Environment: Noisy floor
- Outcome: Regression analysis confirms that promo changes (Policies) and CRM lag (Technology) drive 80% of errors. The process is simplified to one screen, promo rules are moved to weekly releases, and the error rate drops below 1%.
Lean
Lean is a management philosophy that delivers customer value by eliminating waste. It targets the eight classic wastes: defects, over-production, waiting, non-utilized talent, transport, inventory, motion, and extra processing.
In a Kaizen event (short, focused problem-solving workshop used in Lean) teams often create a fishbone diagram to map all waste drivers. This makes it easier to highlight the biggest contributors and decide where to act first.
Example: A plant’s packaging line keeps stopping, causing two hours of waiting waste per shift.
- Fishbone head: “Line stoppage – 120 min/day.”
- Bones (Lean lens):
- Machine downtime
- Unbalanced workload
- Material shortages
- Motion inefficiency
- Defects requiring rework
- Outcome: Team sees that unbalanced workload has the most sub-branches (inconsistent carton sizes, operator fatigue, slow scanner). They level the work and cut stoppage time by 60%.
Key benefits of using fishbone diagrams in Lean & Six Sigma
- Clarifies the problem scope: When you start at the head, you can tie every cause to the same defect metric or waste target, preventing scope creep.
- Structures root-cause brainstorming: Categorizing causes under People, Process, Technology, and other bones ensures focus on all critical areas.
- Highlights data-collection priorities: Crowded branches pinpoint where additional measurements or time studies will deliver the most insight.
- Supports evidence-based decisions: Teams can attach control-chart data or regression results to each sub-bone, then rule causes in or out during the Analyze or Kaizen phase.
- Builds cross-functional alignment: A fishbone diagrams lets operators, engineers and other stakeholders to see how their areas interact, reducing blame and accelerating consensus.
Other diagram types for quality and analysis
While the fishbone diagram helps visualize all the potential root causes of a problem, there are several other go-to diagrams you can use in Lean and Six Sigma.
| Type | Best for | When to use |
|---|---|---|
| Control chart | Monitoring a process over time to spot special-cause variation and confirm stability | During the Measure and Control phases to see whether fixes hold or if new variation appears |
| Pareto chart | Pinpointing the “vital few” causes that create most of the defects, following the 80/20 rule | In the Analyze phase or a Kaizen event to decide which problems to tackle first for the biggest payoff |
| Scatter diagram | Revealing the strength and direction of the relationship between two variables | In the Analyze phase to test whether a suspected factor (e.g., temperature) truly drives the defect rate |
| Histogram | Visualizing the distribution of a single variable to understand spread and skew | Early in Measure to check whether the data look normal before applying capability or statistical tests |
| Run chart | Displaying data points in time order to detect trends, shifts, or cycles quickly | Before a full control chart—use in daily huddles or pilot runs to see immediate effects of changes |
| Box-and-whisker plot | Comparing variation and medians across multiple groups or shifts at a glance | In Analyze when you need a simple visual to show which team, line, or shift has higher variation |
Related: What is a Pert Chart and How Make One? [Examples & Templates]
In summary
We explored over 15 examples of fishbone diagrams to help you effectively brainstorm the causes of problems.
This tool, with its visually intuitive structure, serves as a game-changer in analyzing root causes across various fields, from business challenges to technological snags.
This article doesn’t just present examples but also educates readers on how to harness the power of the fishbone diagram to its fullest.
For anyone inspired to create their own or seeking specialized templates, Venngage stands out as a go-to resource.
Explore Venngage’s diagram maker and discover an array of pre-designed fishbone diagram templates to kickstart your brainstorming sessions.


