


Fishbone diagrams help you visualize complex problems which makes them ideal tools for industry reports, presentations, and academic work.
Also known as Ishikawa diagrams or cause-and-effect diagrams, creating a fishbone diagram can get pretty tricky using Microsoft Word since you have to do everything manually.
If you’re not a designer, this can be frustrating which is why using a Fishbone Diagram Maker or customizing professionally-designed fishbone diagram templates are better methods of creating fishbone diagrams
In this post, I’ll first show you how create fishbone diagrams in Word, and then teach you an easier way using Venngage.
Click to jump ahead:
- How to create fishbone diagrams in Microsoft Word
- How to create fishbone diagrams in Venngage
- Conclusion
To make a fishbone diagram in Word, follow these steps:
- Create a “Blank Document”
- Create the head and spine by clicking “Insert” > “Shapes“
- Use “Lines” to create the ribs (branches)
- Add your text by clicking “Insert” > “Text Box“
- Customize the appearance
- Save and share
If you need some inspiration on how to design a fishbone diagram, head over to Google images and type fishbone diagram templates.
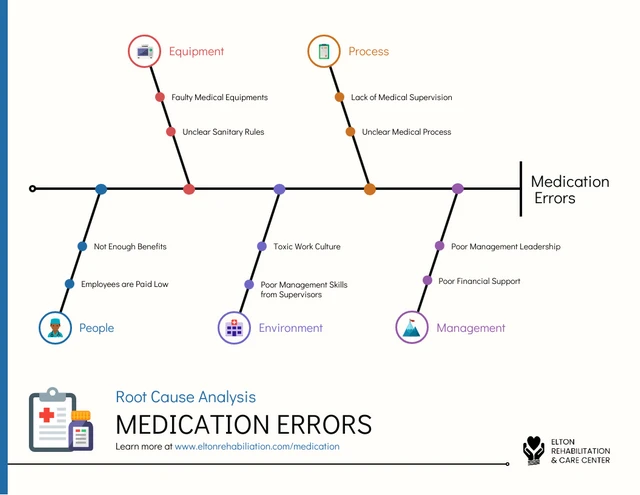
Here’s a great example of a fishbone design you can use to do a root cause analysis of medication errors.
Once you have an idea of how to design your fishbone, it’s time to fire up Word!
A step-by-step guide on creating fishbone diagrams in Microsoft Word
Word is a text-processing tool meant for creating documents and reports. It’s not a specialized diagramming tool.
But since report writers do have to include charts and diagrams from time to time, Word does provide chart creation options, including the fishbone diagram.
But a word of warning. You’ll have to do everything manually, from drawing the fishbone structure and aligning the shapes since Word doesn’t offer editable fishbone diagram templates.
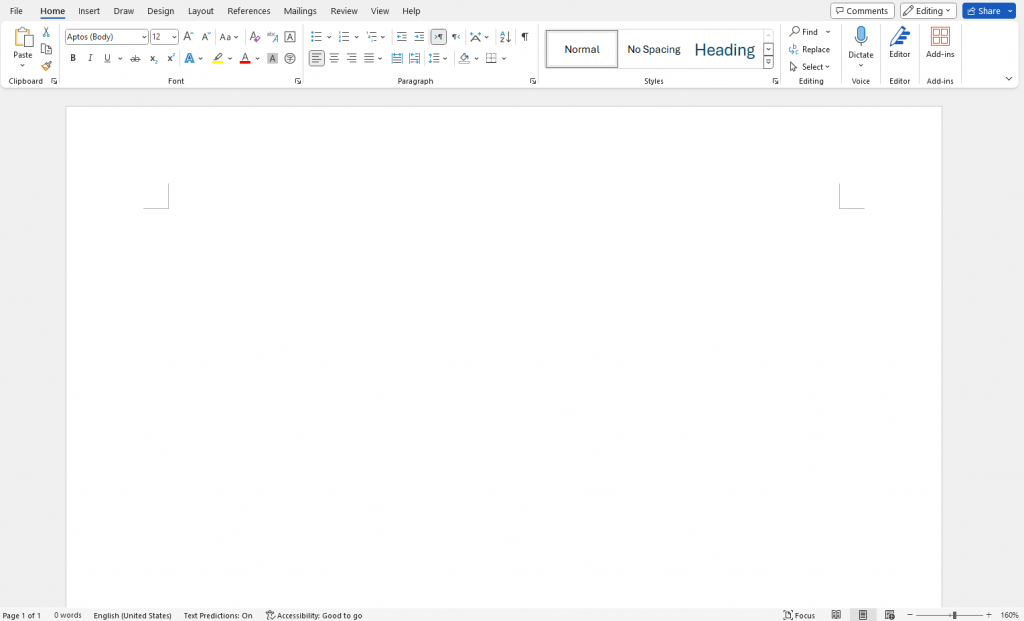
Step 1: Create a blank Word document
The first step to creating a fishbone diagram in Word is to set up a new blank document.
To do this, select the “Blank document” option on Word’s welcome screen.
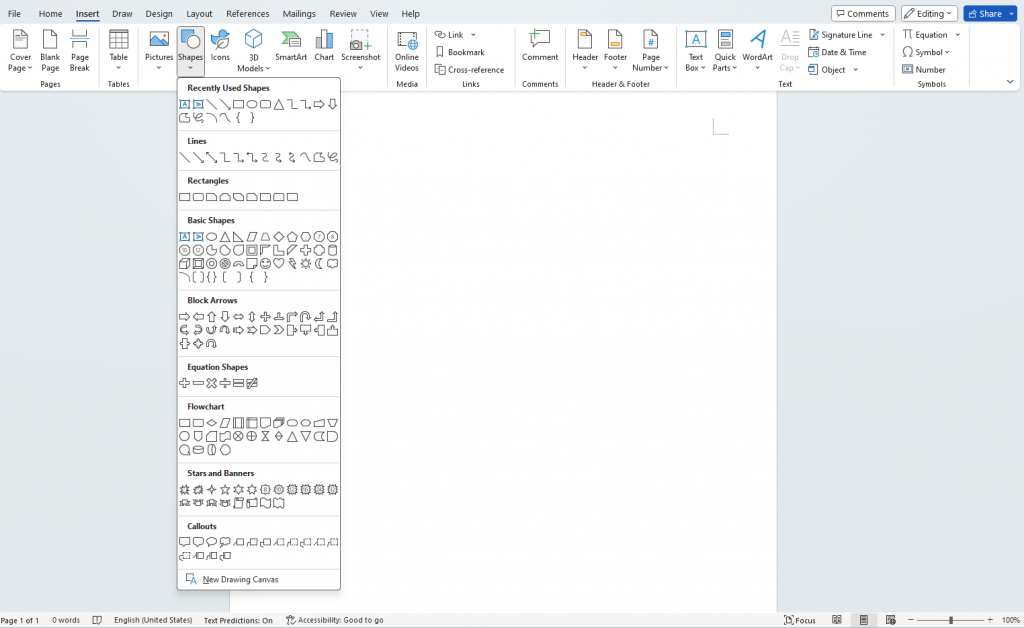
Step 2: Create the head and spine of your fishbone diagram
Next, I’m going to draw the basic backbone of a fishbone diagram by inserting shapes.
To do this, click on the “Insert” > “Shapes” option in Word’s ribbon. You’ll find most of the shapes you need to create a fishbone here.
For reference, here are the shapes and terms commonly used in fishbone diagrams.
- Spine: A straight horizontal line that links branches (ribs) directly to the head (main problem).
- Ribs: Lines that angle out from the spine and represent various causes contributing to the main problem.
- Sub causes: Sub-branching lines that break off from individual ribs.
- Arrows: Provide directionality and indicate flow of information towards the main problem.
- Circles/Ovals: A unique shape that draws attention to the main problem.
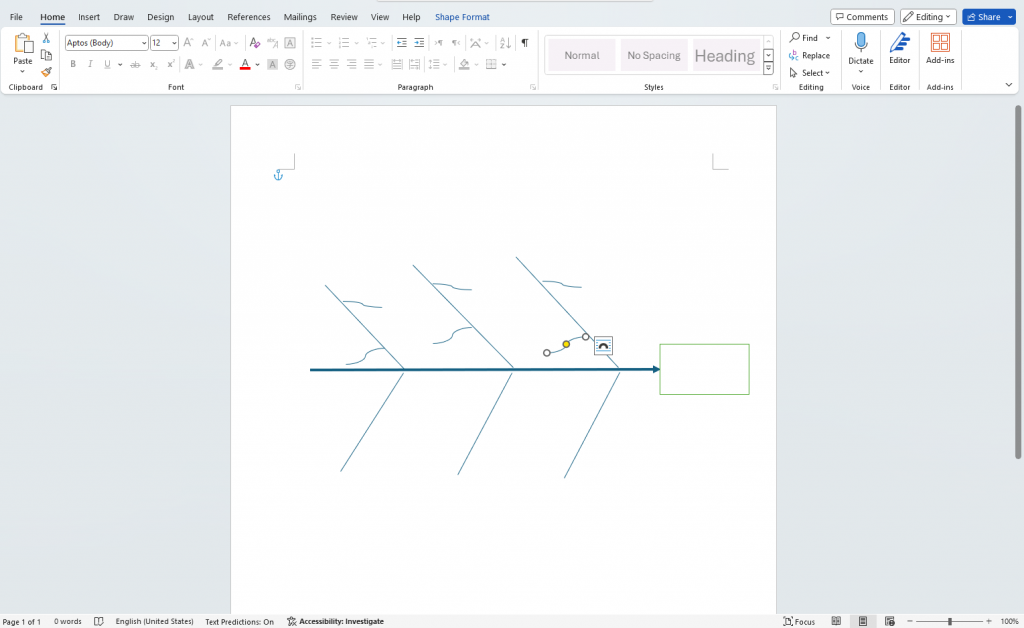
Start by drawing a line across the center of your document, from left to right.
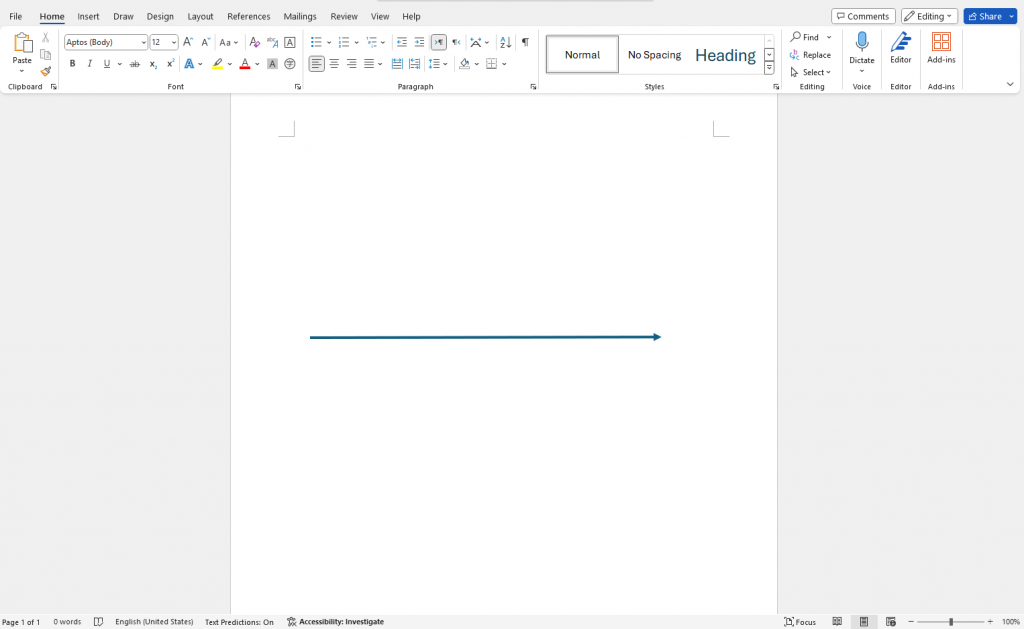
Note: You can customize this line’s appearance from the “Shape Format” ribbon that appears after you draw it. Feel free to change its color or the line weight like I did.
After you’ve done this, draw a rectangle, circle, or oval (this can be any shape really) to represent the main focus problem of your fishbone diagram.

Step 3: Add the ribs of your fishbone diagram
The ribs refer to branches (lines) that extend out from the spine. Each rib generally represents a potential cause that contributes to the main problem.
When adding ribs, make sure to angle the lines outwards from the spine like in the example below.
You can also add sub-causes which are smaller branches that pan out from an individual rib.
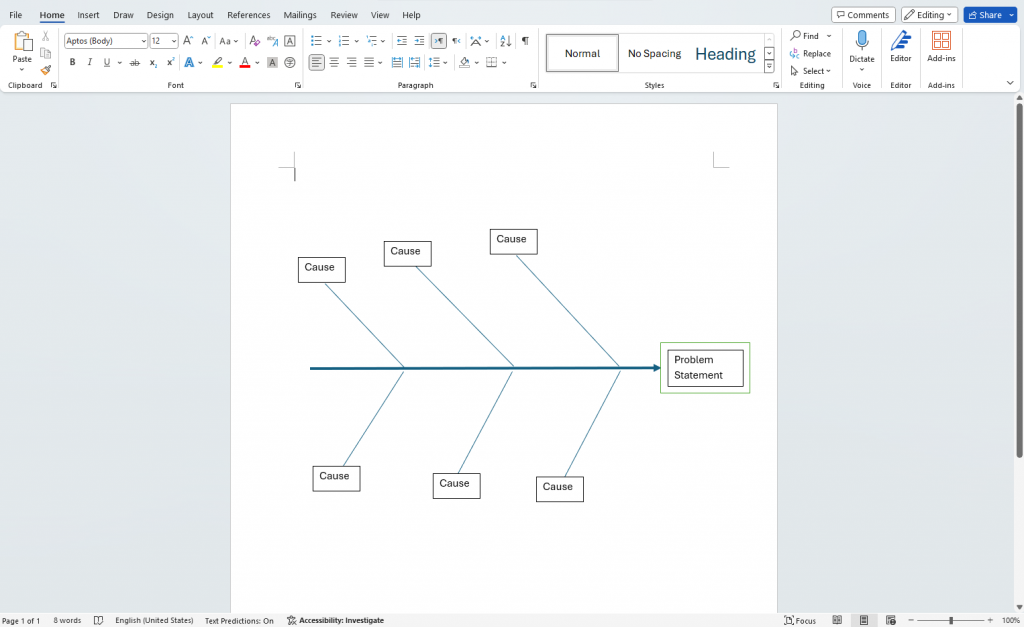
Step 4: Add text to provide context to your fishbone diagram
So far, my fishbone diagram doesn’t say much because I still need to add text to give it context.
Though this step seems straightforward, it can get frustrating.
To add text, you have to click on “Insert” > “Text Box“. This will then create a pop-up where you can type, but what’s annoying is you have to drag the text into place and Word’s drag-and-drop capability definitely isn’t the best.
Here’s how my attempt panned out.
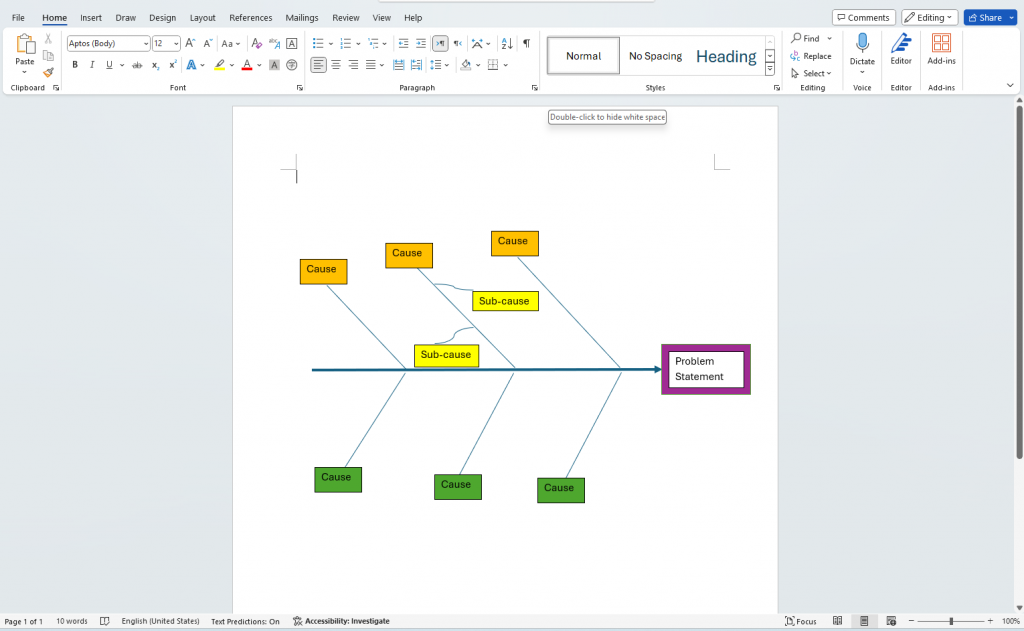
Step 5: Customize the appearance
Well, I have a functional fishbone diagram but I’d be embarrassed to share it in a report, meeting, or presentation if I’m honest.
Let’s see how we can customize this diagram in Word to make it a bit more professional.
Perhaps the font size is too small or you want to highlight a certain category to visually communicate its importance.
Or maybe, your fishbone diagram just looks plain boring (like mine!) and you want to spice it up a little bit, with color, graphics, and icons to make it engaging.
Well, you can do some of that in Microsoft Word.
For example, I was able to change the color of each cause on the two branches and the problem statement.
Step 6: Save and share your fishbone diagram
Once you’re done designing, you can save the document as Doc, Docx, PDF, or even HTML.
How to create a fishbone diagram with Venngage
If you want to avoid spending hours creating a fishbone diagram in Word and maybe pulling your hair out in the process, your prayers have been answered.
Venngage is a powerful design solution for business communications you can use to create or edit polished, clean fishbone diagrams without any design skills necessary.
Don’t you love it when your life is made easy? Fishbone diagrams made in Venngage easily integrate into business reports, research papers, and presentations.
Here are a few examples of fishbone diagram templates you can edit in Venngage and make your own in minutes.
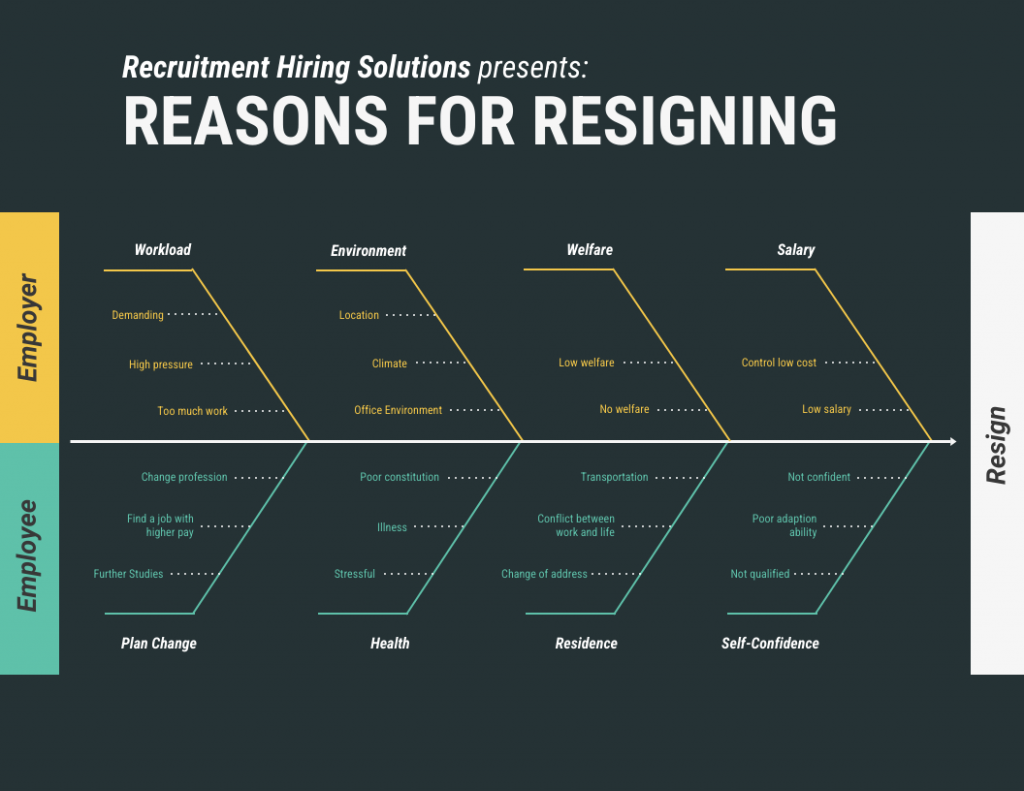
This fishbone diagram is perfect for HR departments wanting to analyze reasons why employees resign from two angles: personal reasons or employer-related factors.
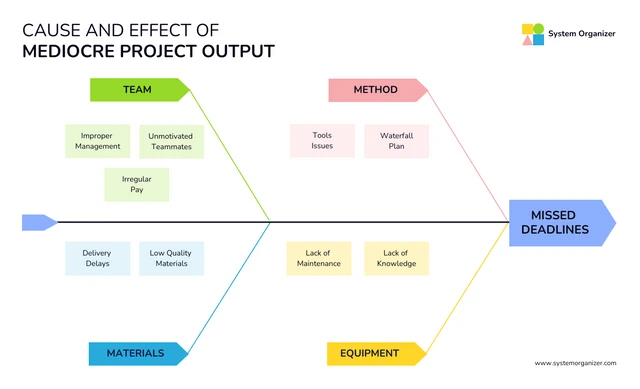
This cause and effect diagram is perfect for any department wanting to figure out why project deadlines are missed. The diagram is divided into four branches, with each representing a category of potential causes and color-coded for easy distinction.

This fishbone diagram has a very specific use case and attempts to answer reasons why HR departments cannot produce reports, but you can easily change this problem to your own and keep the design and style of the diagram.

Now that you’ve seen some examples of fishbone diagram templates in Venngage, let’s walk through the editing process together.
Step 1: Sign up for a Venngage account (it’s free!)
Sign up for a Venngage account for free using your email, Gmail, or Facebook.
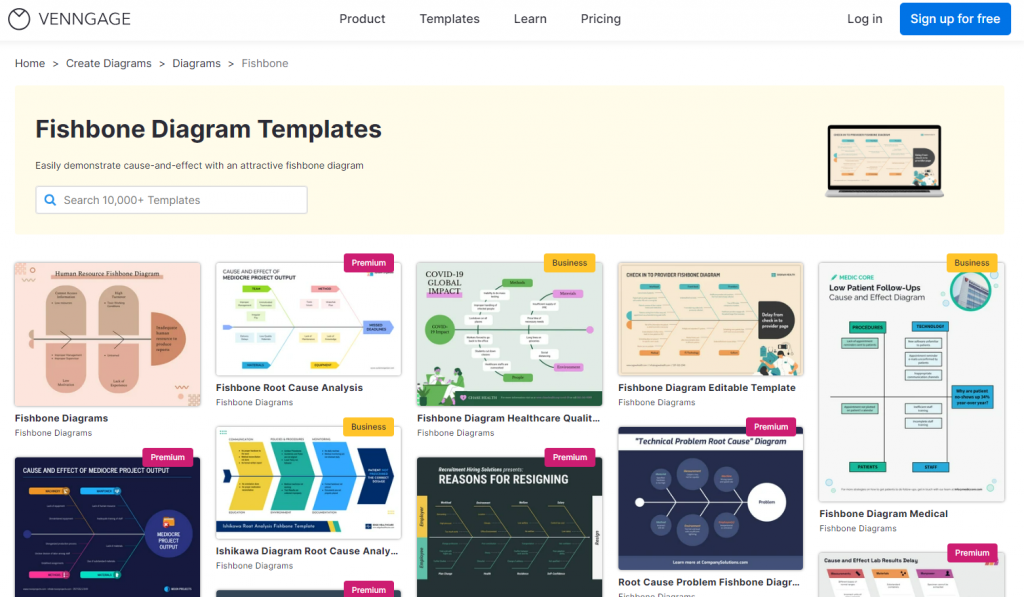
Step 2: Browse to our diagram templates and select the fishbone subcategory
Browse to our templates page and click on the Diagram category to open up the drop down menu.
Here, you’ll see our list of diagram templates, including fishbone diagram templates. Click on the fishbone subcategory to see all the template options.
Note: Some of our fishbone templates are free and some require a small monthly fee. Sign-up is always free, as is access to Venngage’s online drag-and-drop editor.
Step 3: Customize your fishbone diagram
Once you’ve opened a template in our editor tool, you have a range of customization options to make it your own.
In Venngage, it’s much easier to change text compared to Word. Just select existing text and then type in your information. You can also reposition it by dragging it to your desired location.
Changing colors, fonts, and all other basic design tasks is also simpler and faster when you use Venngage.
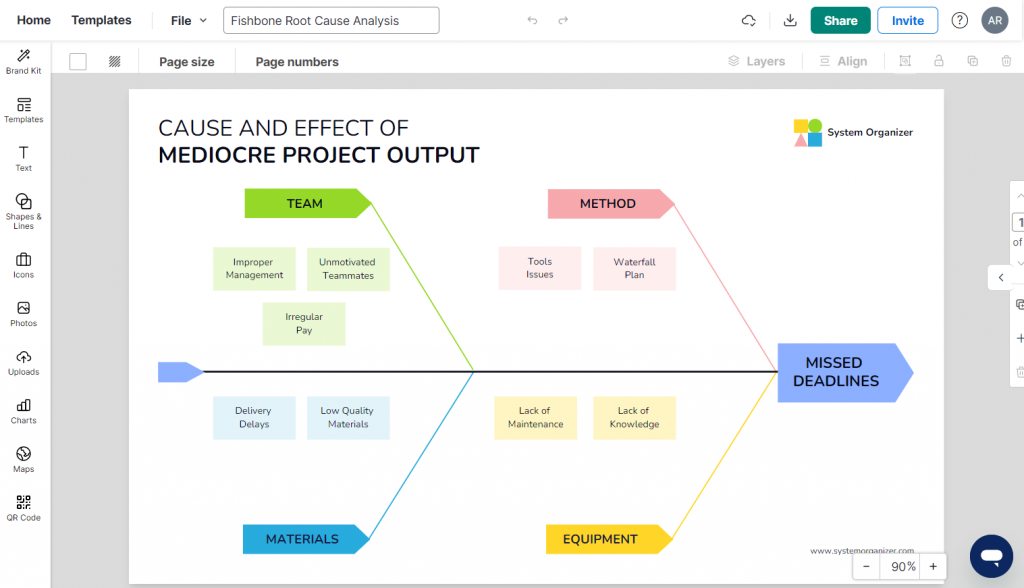
Remember this fishbone diagram from our earlier example?
Here’s how it looks when you open in the Venngage editor.
You’ll see the editing features on the left-side with options like “Text“, “Shapes & Lines“, “Icons” and more.
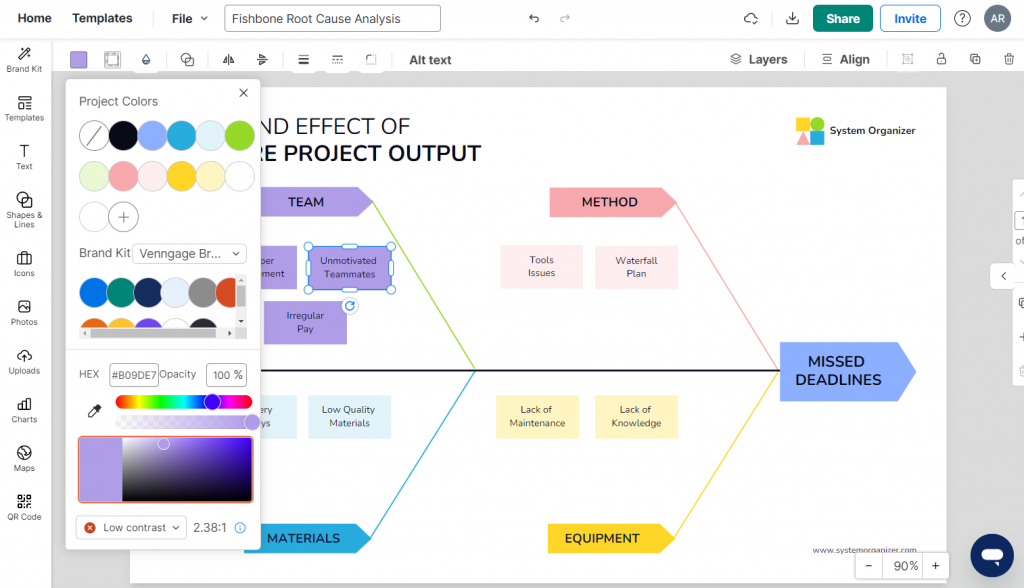
Now let’s say I don’t like the color scheme of one of the branches and want to change it.
It’s easy and intuitive in Venngage. Just select a shape and click on “Fill Color” at the top to see your options (you can also pick a color using a HEX code).
I changed the top left branch of this fishbone diagram to a shade of light purple.
Our editor also gives you access to thousands of free, professional icons, plus diverse icons to reinforce your text visually. There’s no need to import from an external source!
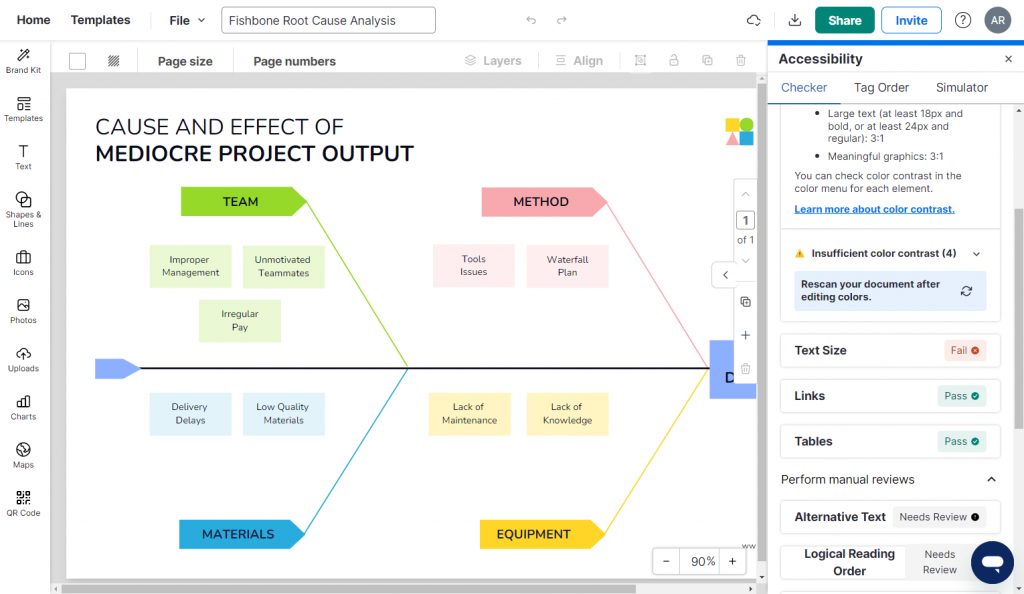
By the way, not only does the Venngage editor help you produce fishbone diagrams faster, but it’ll also tell you if your designs are accessible.
Our in-built accessibility checker tests your fishbone diagrams to ensure they are WCAG compliant so that they can be understood by everyone at meetings, presentations, or wherever you share the design.
Click on “File” > “Accessibility” > “Check Accessibility“. A side-bar will pop-up on the right of the editor where you can check the design.
In my case, I still need to work on text size and color contrast to make this fishbone diagram accessible.
Here are some more examples of fishbone diagram templates available in Venngage.
This fishbone diagram is great for healthcare setting as it analyzes the factors contributing to patient wait time.

This fishbone diagram template attempts to uncover potential reasons for a defective product which can be an asset in a manufacturing setting.

This fishbone diagram shows the reasons for car engine failures. It can be a great educational tool to train mechanics or simply double as an infographic to educate people.

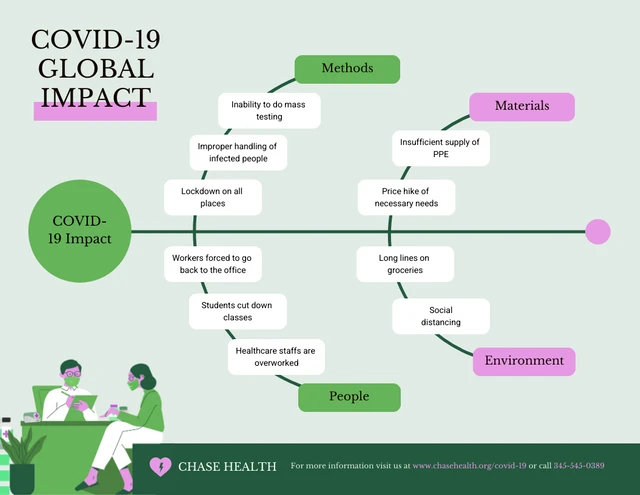
Speaking of infographics, fishbone diagrams can be used outside business settings. They’re pretty handy when you want to to explain concepts like factors behind environmental change.
This fishbone diagram is a great example. It shows how the Covid-19 pandemic affected various aspects on society with branches off from the spine presenting different categories of impact,
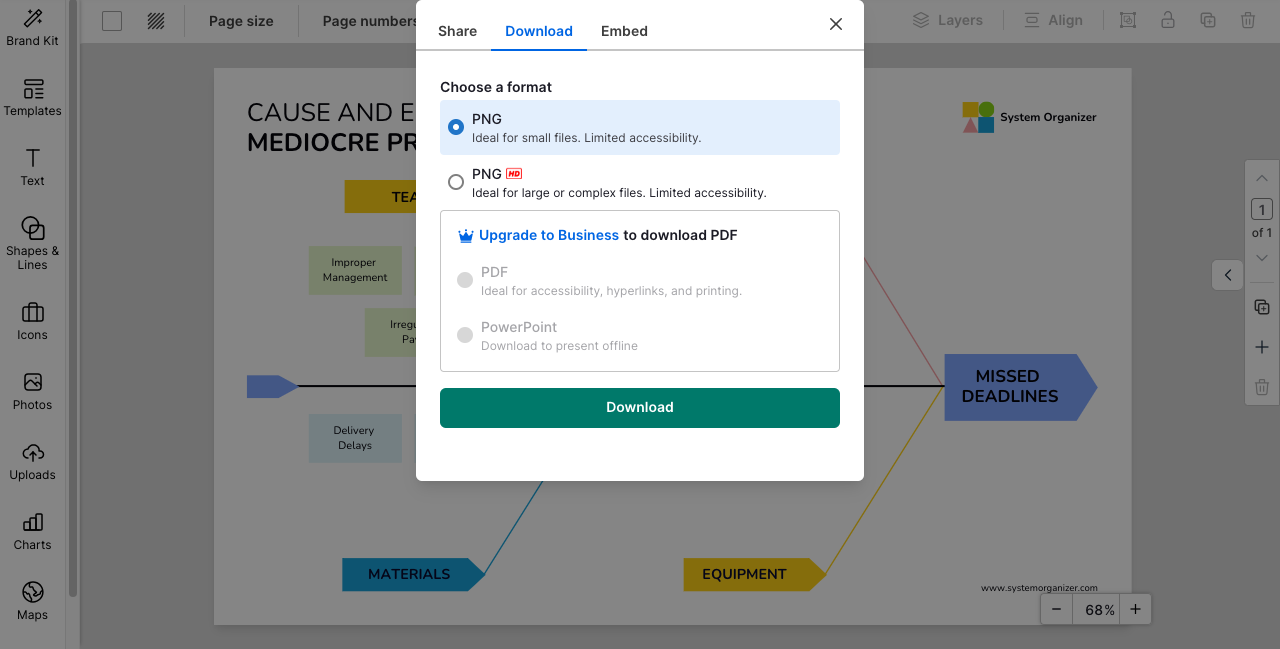
Step 4: Share your fishbone diagram with a link or download it
Once you’re happy with your fishbone diagram, you can share a link to it (available to all users).
If you want to download your fishbone in a variety of formats like PNG, PDF, or even PowerPoint, upgrade to a Business account.
Additionally, with a Business Plan, you’ll get access to My Brand Kit, which lets you apply brand colors to your designs with one click.
Conclusion: Tackle business problems using professional fishbone diagrams from Venngage
No one likes hard-to-read and cluttered fishbone diagrams. But that’s what you’ll get on Word which might just lead to more problems instead of solving them.
So why not impress your team or management with, fun, and engaging fishbone diagrams made in Venngage at your next brainstorming session or meeting?
To get started, check out our fishbone diagrams today. Happy creating!


