


Brainstorming is a powerful problem-solving technique used by businesses to innovate and improve operations.
An example of how brainstorming pays off is Toyota and lean manufacturing. It wasn’t luck that led to it but figuring out the root cause of problems in a structured manner using tools like the fishbone diagram.
Though fishbone diagrams aren’t super popular like flowcharts, they’re still pretty handy and easy to create in Microsoft Excel.
In this post, I’ll show to create Fishbone diagrams using Excel and then show you how to use Venngage’s Fishbone Diagram Maker and/or fishbone diagram templates.
Click to jump ahead:
- How to create a fishbone diagram in Microsoft Excel
- How to create a fishbone diagram in Venngage
- Conclusion
To create a fishbone diagram in Excel, follow these steps.
- Step 1: Open a blank spreadsheet
- Step 2: Go to “Insert” > “Shapes” to draw the spine and head of your fishbone
- Step 3: Use the “Shapes” option to draw the the ribs of your fishbone
- Step 4: Use the “Shapes” option to draw the sub-ribs (if needed)
- Step 5: Add text to your fishbone diagram
- Step 6: Customize your fishbone diagram
- Step 7: Save and export
If you want to avoid this manual method of creating fishbone diagrams in Excel, there is another way but you’ll need to have some technical knack and figure out how install the SPC Excel add-on.
This add-on gives you the ability to fishbone diagram templates directly into Excel.
But if you’re working with Excel that comes installed out-of-the-box, continue reading.
A step by step guide on creating fishbone diagrams in Microsoft Excel
Fishbone diagrams resemble (as you may have guessed) a fish with a “head” and “spine” section.
But sometimes, you’ll also hear people refer to them as Ishikawa diagrams or cause-and-effect diagrams.
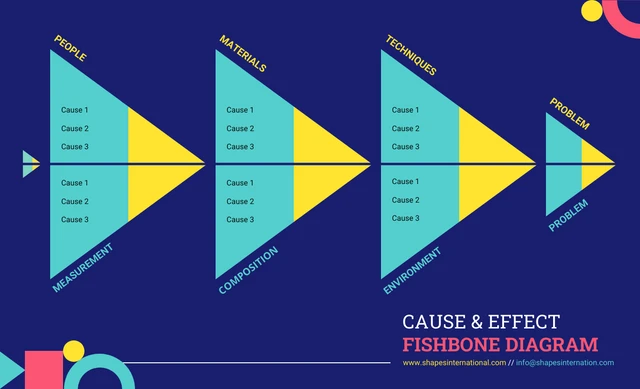
Here’s an example of a fishbone diagram:

Let’s see how to can create a fishbone diagram like this in Excel.
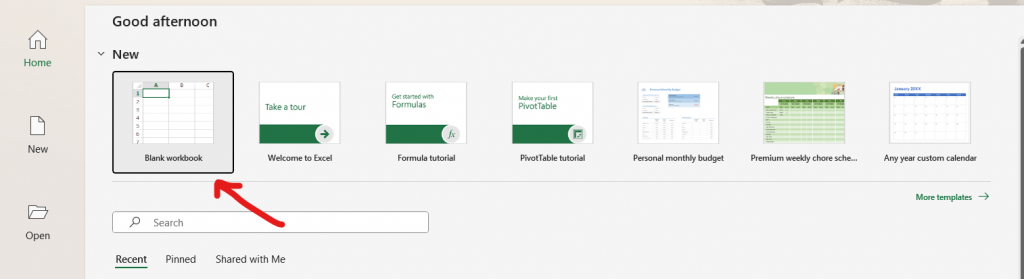
Step 1: Prepare your spreadsheet
Load up Excel and on the welcome screen, choose the “Blank workbook” option to get a fresh spreadsheet to work with.
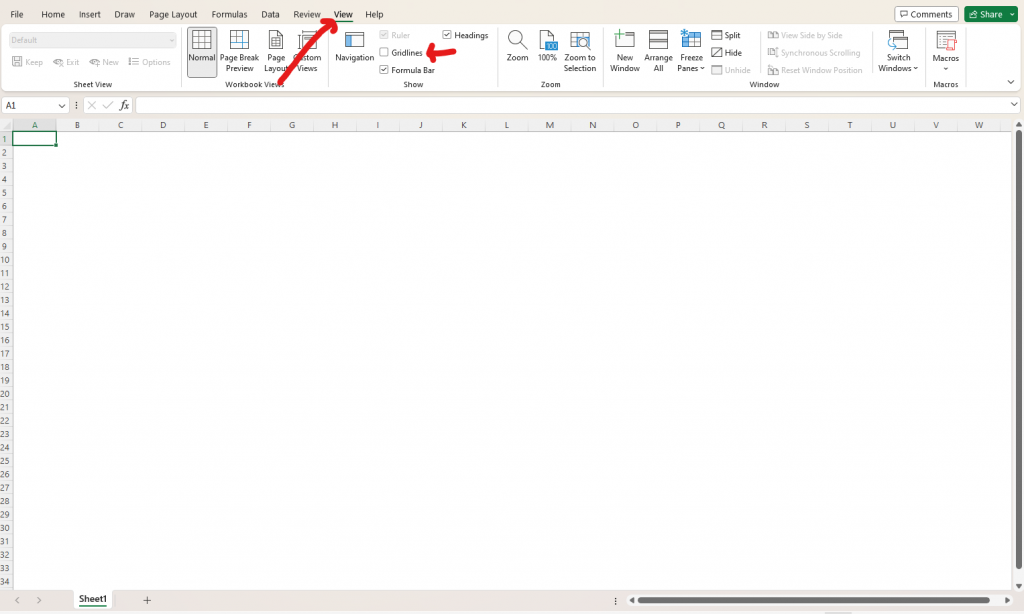
Normally, this will load a spreadsheet with gridlines but we want to remove these as they clutter the space and aren’t needed for diagramming.
To do this, click on the “View” tab and then uncheck “Gridlines.”
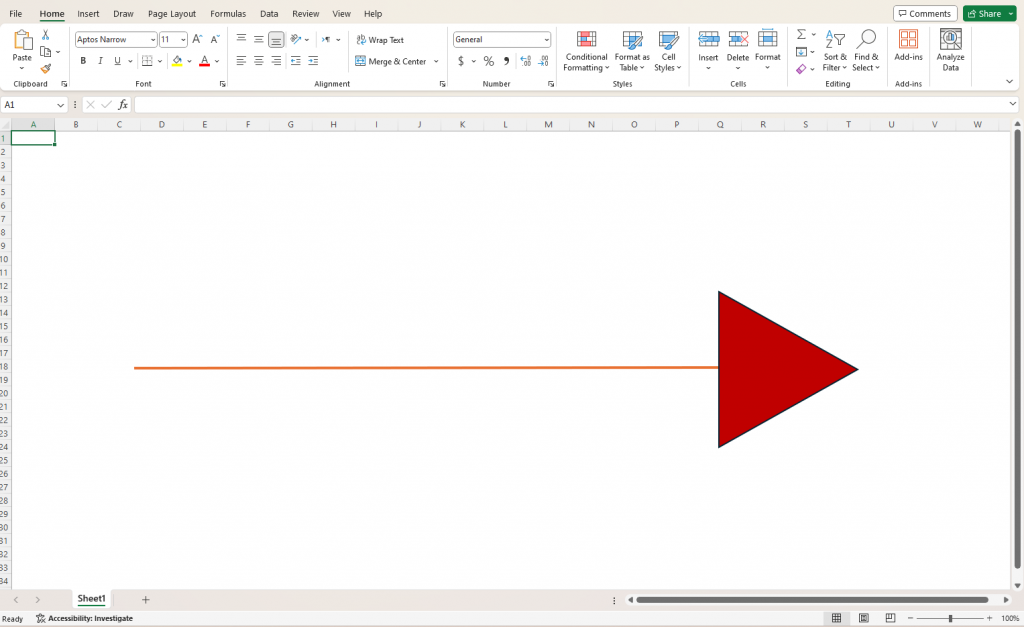
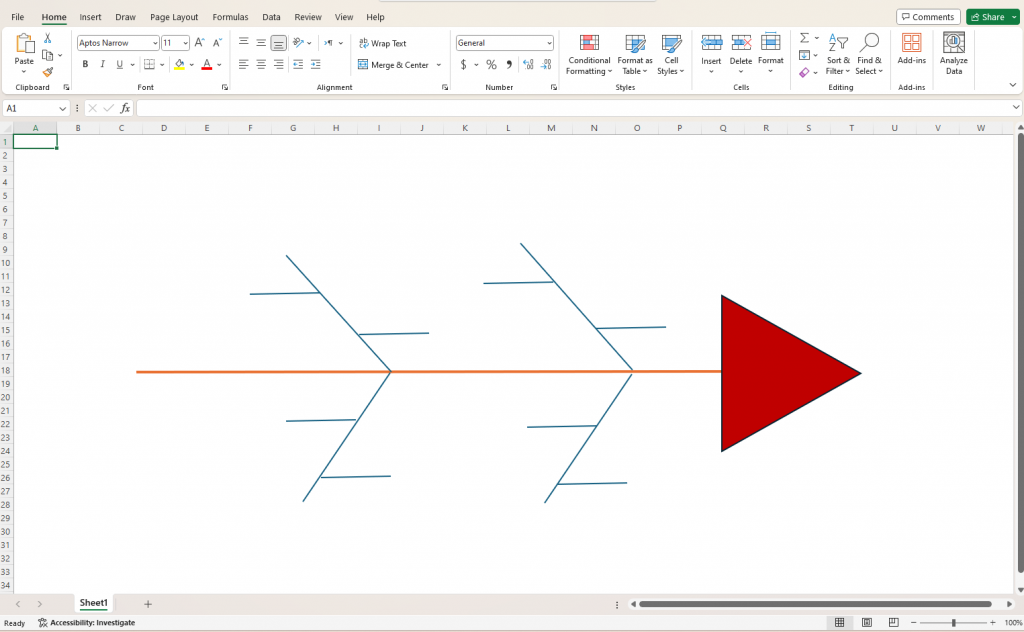
Step 2: Draw the spine and head of the fish
Unlike other diagrams, Excel doesn’t offer any fishbone diagram templates so your only option is to draw them manually using the provided shapes.
If you want some design inspiration, one hack you can use is Google fishbone diagram templates and try to recreate the design in Excel.
Start by drawing the spine and head (problem statement) of your fishbone by going to the “Insert” tab. Click on “Shapes,” and then select a straight line and a shape of your preference.
For reference, here are the shapes and terms commonly used in fishbone diagrams:
- Spine: A horizontal line that links branches to the head of the fishbone.
- Ribs: Lines that angle out from the spine and highlight potential causes of the main problem.
- Sub-ribs: Smaller lines that break off from individual ribs to further detail contributing factors.
- Arrows (optional): While not always used, arrows can point outwards from the spine towards the sub-causes.
- Text: Text is essential throughout the fishbone diagram. It describes the main problem, each cause and sub-cause, and any additional details that provide context and understanding.
Don’t be afraid to be creative and experiment with your shapes.
For example, my problem statement is a triangle that’s been rotated 90 degrees to match the example template from earlier in the article.
I also changed the line weight of the spine to make it more prominent and visible.
Step 3: Add the major cause categories
Now that the basic structure is ready, it’s time to create the sub-structure of the fishbone (the ribs of the fishbone diagram) or the potential causes that contribute to the problem statement.
Again, go to “Insert” and then select “Shapes” to add lines that branch out from the spine (make sure to angle them slightly).
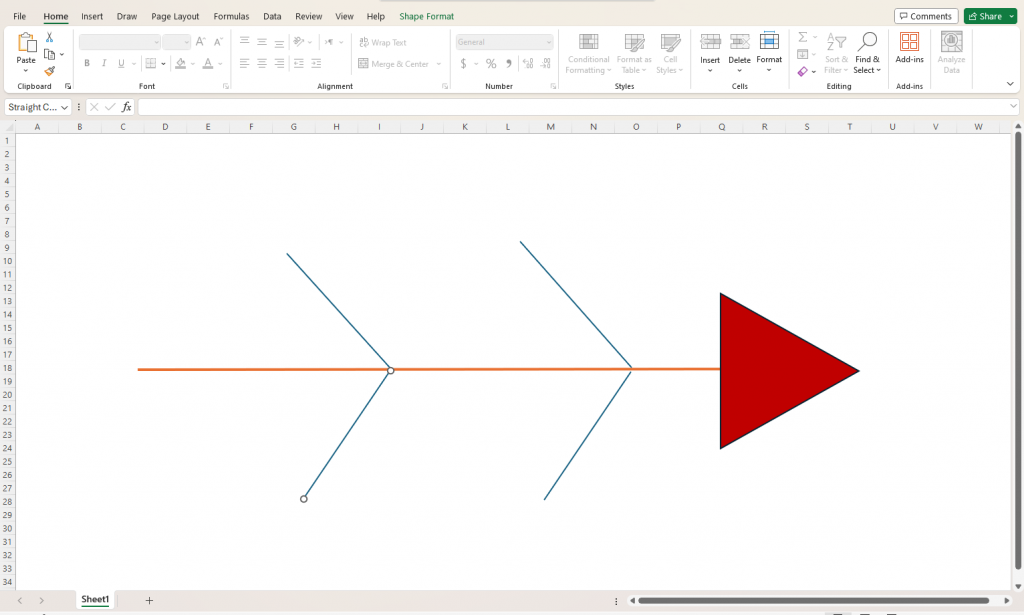
Step 4: Add specific sub-causes (if needed)
Though not always necessary, you can also add sub-branches to each cause category or rib for a deeper analysis of the root causes of a problem.
Again, to do this, go to the “Insert” tab and click on “Shapes” and select lines again. This time, draw lines that branch out from a rib.
Step 5: Add text to your fishbone diagram
The shape of my fishbone diagram is ready, but I still need to add text to explain what the problem is and how different causes contribute to it.
To add text, you have two options in Excel:
- Add a text over a shape directly by double-clicking it and typing
- Click on “Insert” > “Text” > “Text Box“
Here’s how my fishbone diagram looks now.
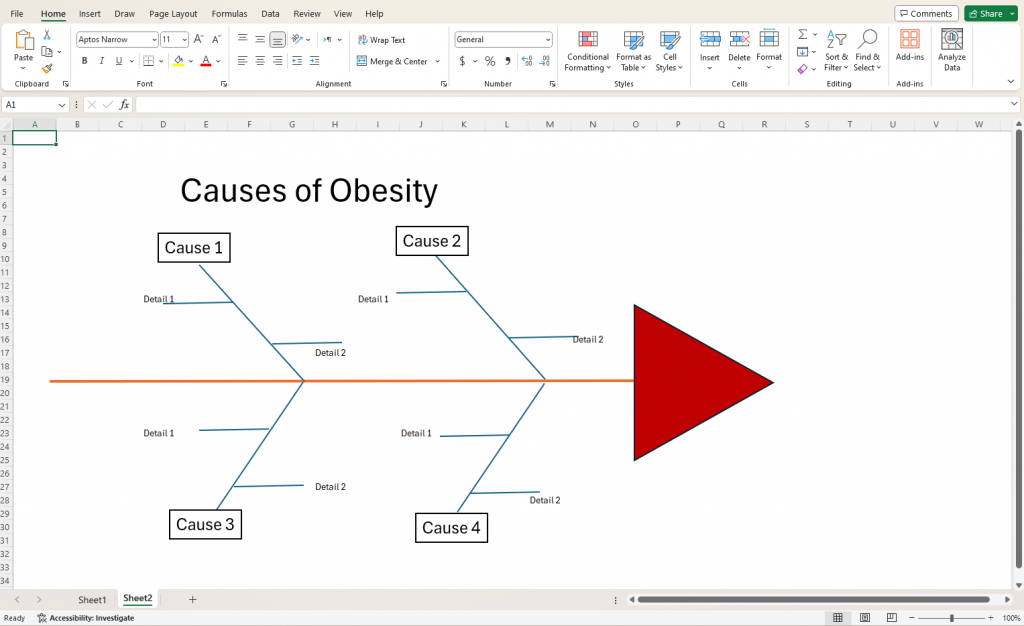
There are few points I want to mention here to avoid confusion. In my fishbone diagram, I added the problem statement at the top of the diagram instead of the problem statement area.
Also, each “detail” text was added manually by double clicking the cell next to the arrow which is why you can see alignment issues.
For the “Causes”, I used the “Insert” > “Text Box” option, added a border around the text, and then dragged it into the exact place I wanted.
Step 6: Customize your fishbone diagram
Though my fishbone diagram isn’t too bad at the moment, it could be made better visually and in some cases it might even be necessary.
For example, if your fishbone diagram is going to be used in a company presentation, it’ll need to match company branding (colors and fonts).
In other cases, you might just want to make the fishbone diagram easier to read by giving visual cues to readers.
In my example, I changed the colors of each cause and sub-cause to make it easier to visually distinguish different causes.
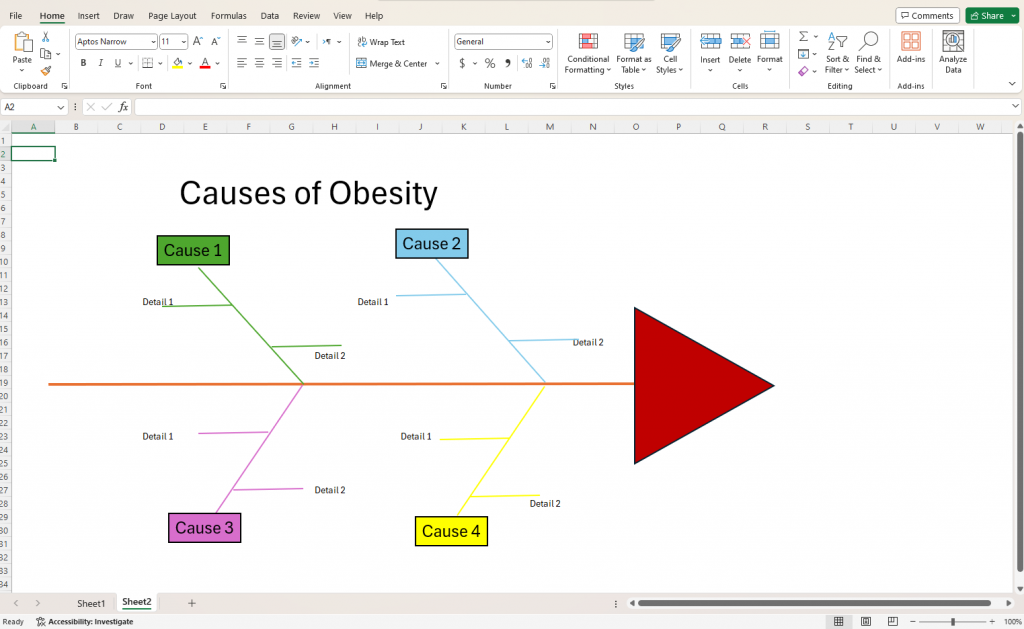
Other customization options include ability to change shape style, fonts, line weight, and add cool icons and graphics to your fishbone (but Excel’s library is pretty limited in this regards).
Step 7: Save and export your fishbone diagram
Once you’ve finalized your fishbone diagram, it’s time to download it and share it with the world!
Click on “File” and then “Save As” to select the format for your fishbone diagram.
Alternatively, you can click on “Export > PDF” to get the file in a PDF or embed it in a email by clicking “Share” > “Email” > “Email Address”.
How to make a fishbone diagram in Venngage
Now that you’ve seen how to create a fishbone diagram in Excel manually, can you imagine repeating this process each time, especially when there’s more causes-and-effects to explore?
That’s why you should use Venngage instead. It’s a simple AND powerful design solution for business communications.
Venngage offers a much faster (and fun!) way to make fishbones by letting you edit fishbone diagram templates using an intuitive drag-and-drop interface.
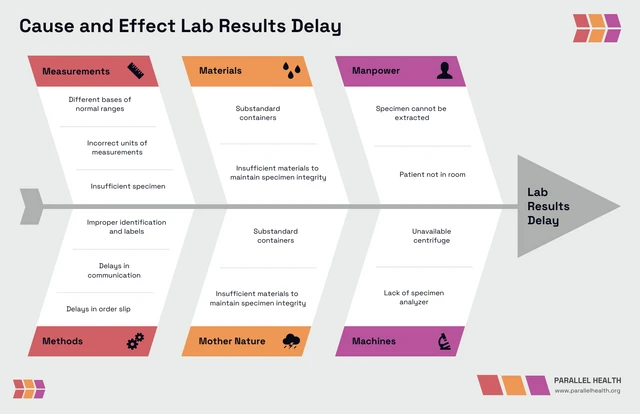
Here are a few examples of creations you can make your own in minutes.
This fishbone diagram illustrates various causes of lab results delay and includes a company logo at the bottom right. It’s a great option for anyone wanting to address operational inefficiencies within laboratory processes.
This fishbone diagram template is colorful and modern and uses blue and yellow triangles to form the bones of the fish that point towards the head.
This template is a great option for anyone wanting to organize the potential causes of a problem in a way that is both aesthetically appealing and functionally effective.
This fishbone diagram outlines various factors contributing to climate change using icons.
This template is a great option for anyone wanting to present or teach causes in a visually intuitive manner.

Now that you’ve seen the quality of fishbone diagrams you can create in Venngage, let’s see how easy it is to edit these templates.
Note: Some of our fishbone diagram templates are free to use and some require a small monthly fee. Sign-up is always free, as is access to Venngage’s online drag-and-drop editor.
Step 1: Sign up for a free account
Sign up for a Venngage account using your email, Gmail or Facebook account.

Step 2: Browse to our fishbone diagram templates page
Head to our templates page where you’ll see a list of template categories on the left side of the page.
Click on the “Diagram” option to see the list of subcategories where you’ll find fishbone.
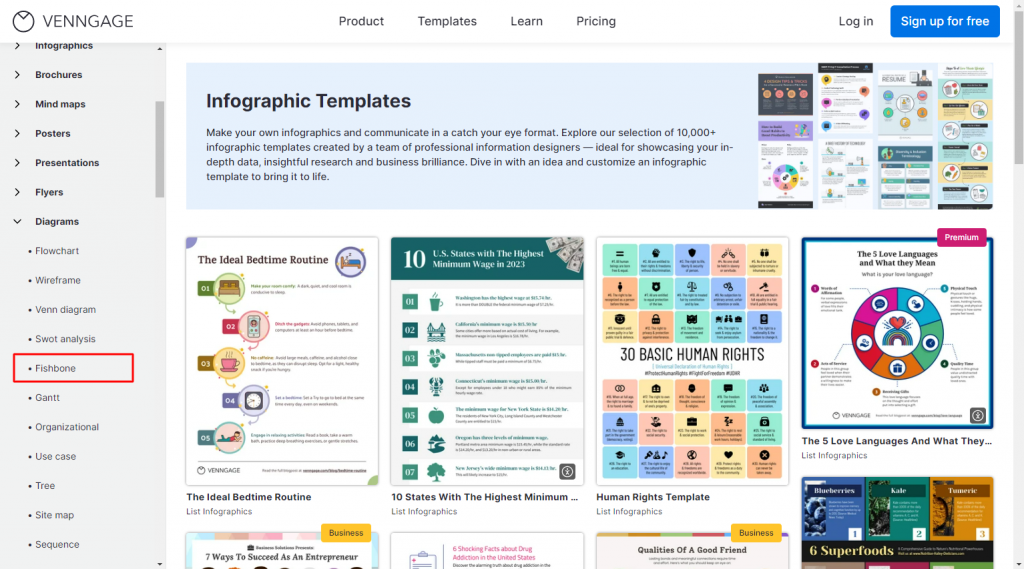
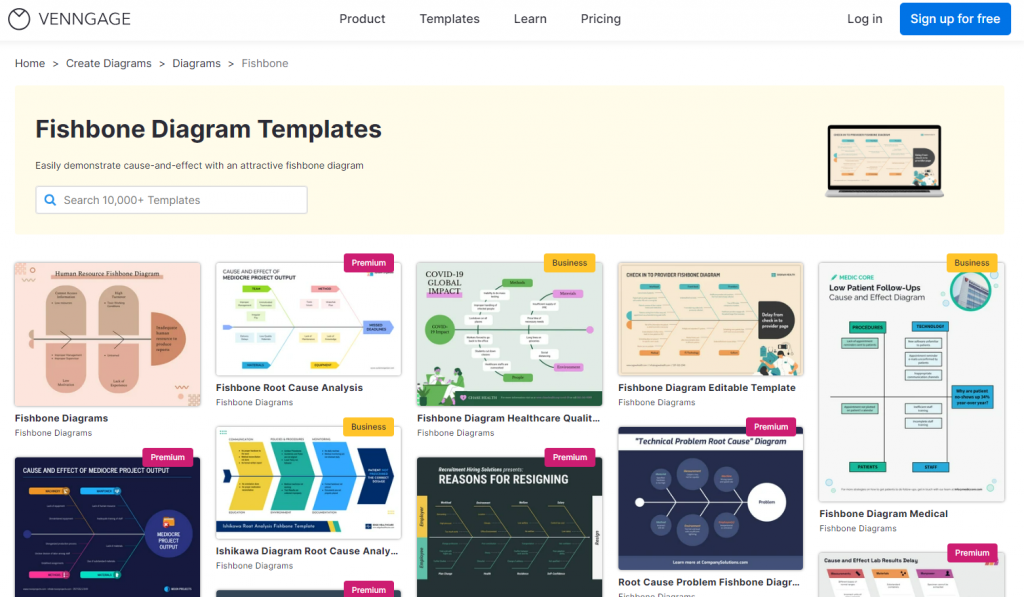
Click on “Fishbone” to open our fishbone diagram templates page.
Step 3: Customize your fishbone diagram template
Once you’ve found a template you like, click on “Create” to open our editor tool.
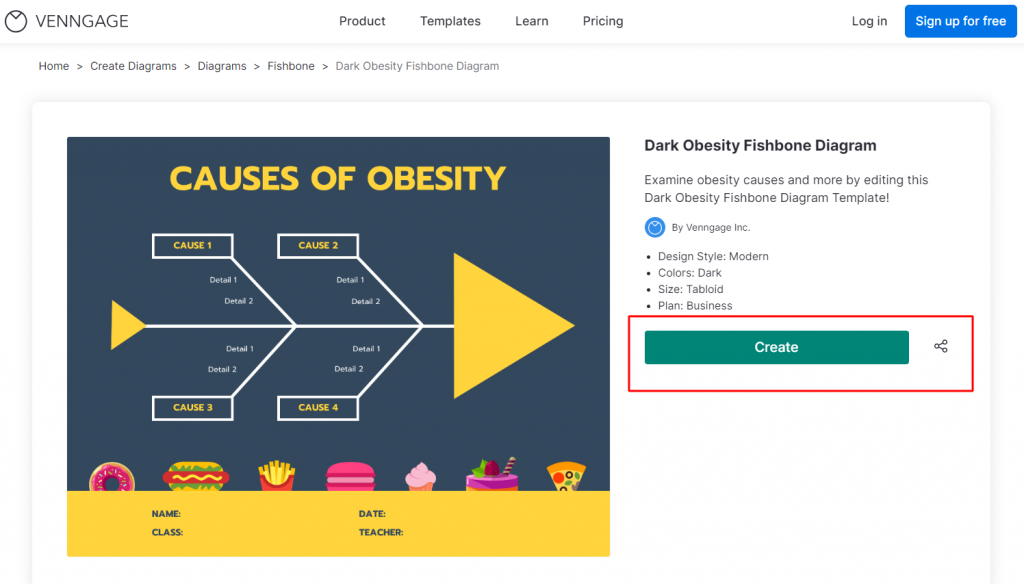
This will open it in our editor tool but don’t worry, you don’t need to be a designer or have design skills to edit a fishbone diagram.
You’ll be greeted with a drag-and-drop interface and editing options, like the ability to add text, shapes, lines, and icons. You don’t have to waste time figuring out where something is like in Excel.
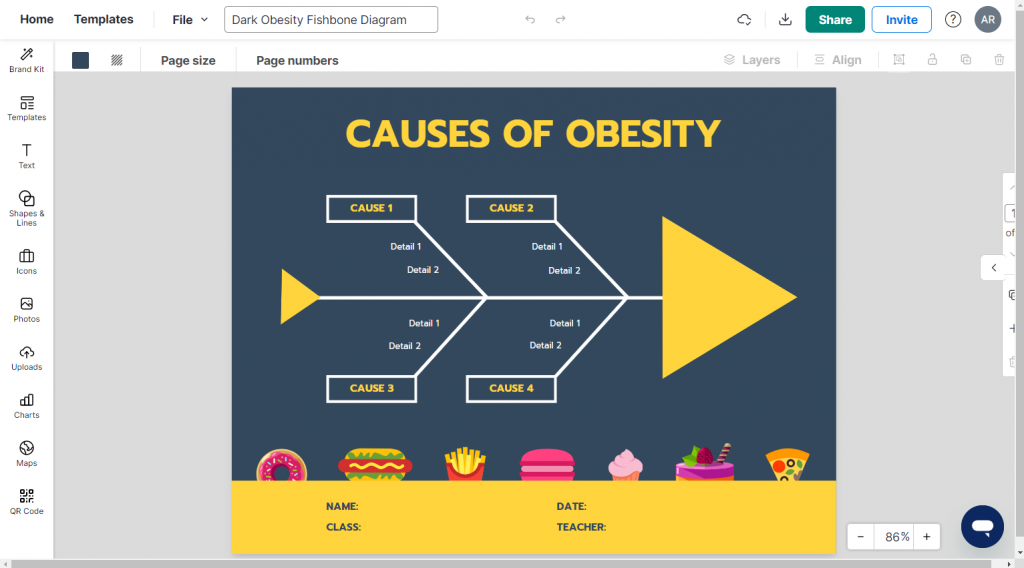
For example, I’m not a fan of this dark navy blue and yellow theme as it looks a bit too serious.
I want to make this fishbone diagram more fun and share it as an assignment to give to kids in a class.
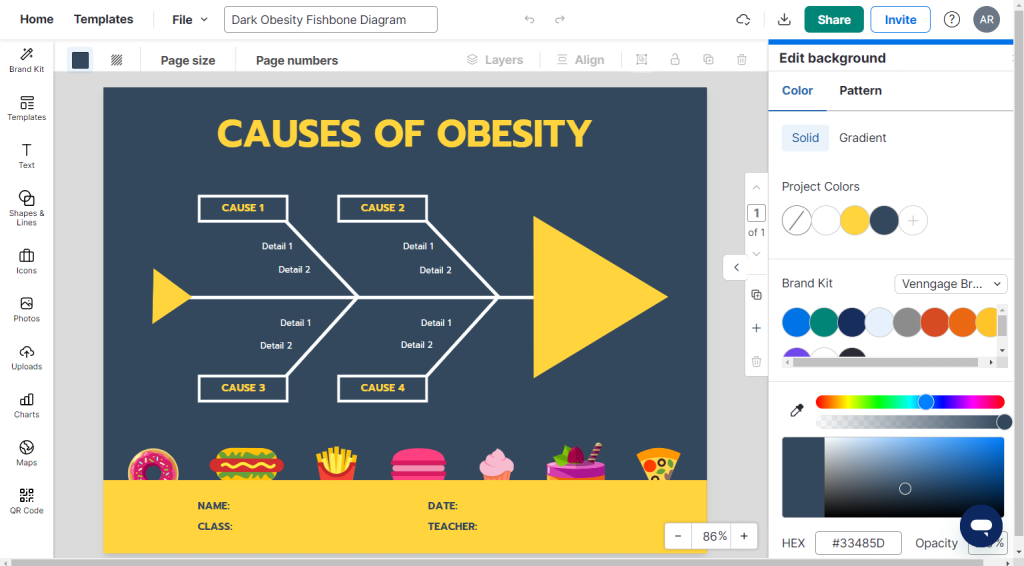
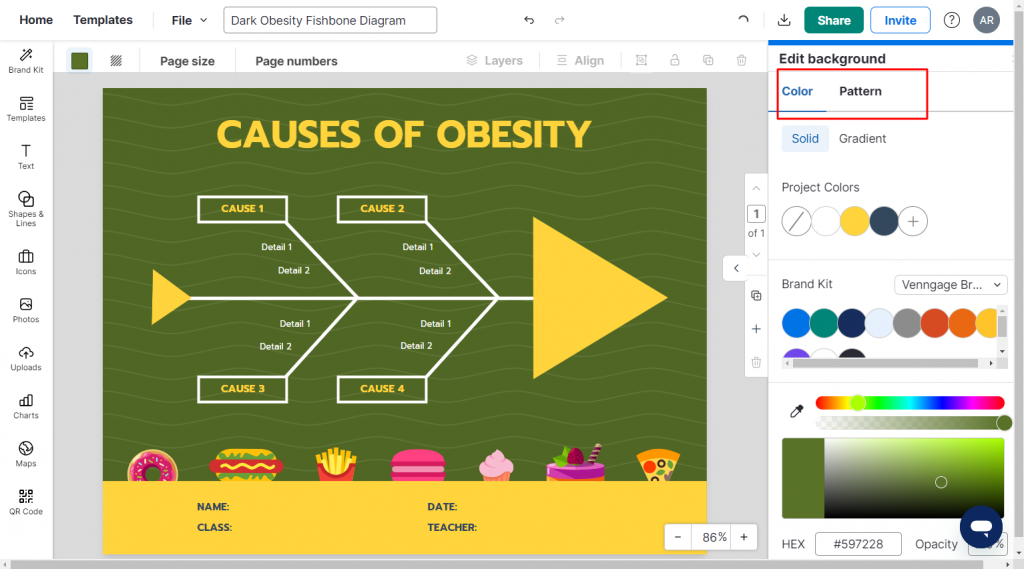
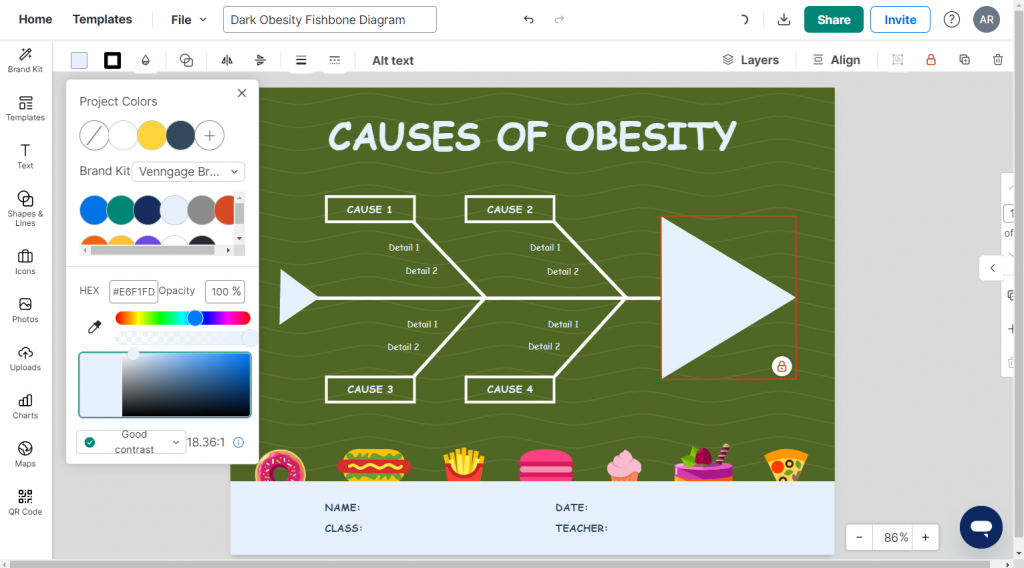
I’ll first change the color scheme to a playful green which is straightforward in Venngage. Just select the background color and click the square color box on the top left of the editor.
This will open a color picker (and yes you can be very specific and use HEX code).
Here’s how my fishbone diagram looks now (Venngage even lets you add cool patterns to make templates fun and engaging).
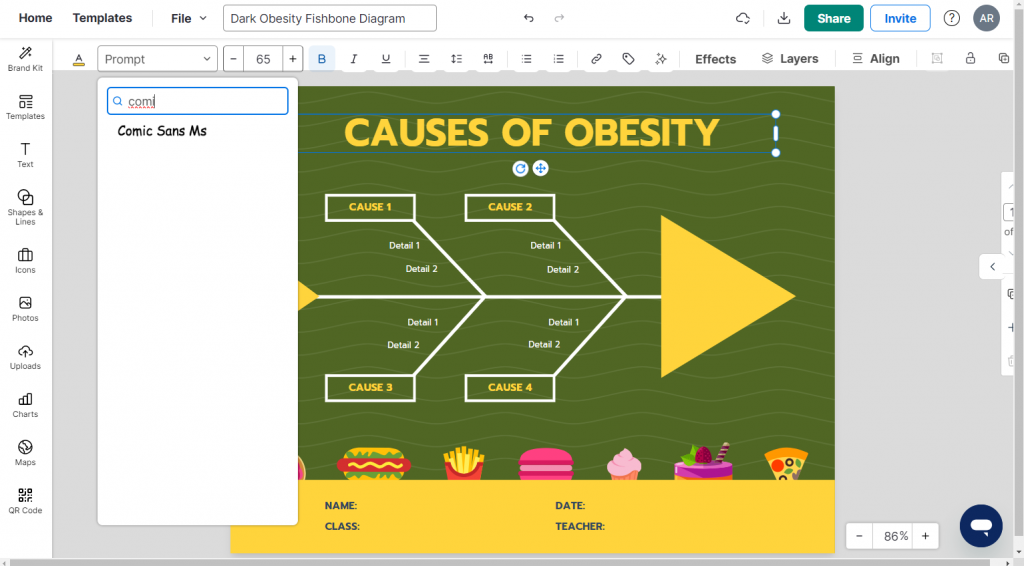
Next, I’m going to change the fonts and the yellow theme to make the appearance even more playful.
In Venngage, changing the fonts of a fishbone diagram template is easy. Just select a text and replace it with your font of choice (you can search for fonts too!).
Next, Ill change each element that is yellow into a shade of grey. What really sets the Venngage editor apart is that as you change colors in your design, it’ll tell you if the contrast ratio is good or bad.
This is important for creating accessible designs that are understandable to people living with disabilities. Imagine handing this fishbone diagram out as an assignment to a child who has low vision capabilities and can’t distinguish the colors.
Our in-built accessibility checker lets you test your fishbone diagrams to ensure they are WCAG compliant so that they can be understood by everyone no matter to who or where you share the design.
Click on “File” > “Accessibility” > “Check Accessibility“. A side-bar will pop-up on the right of the editor where you can check the design.
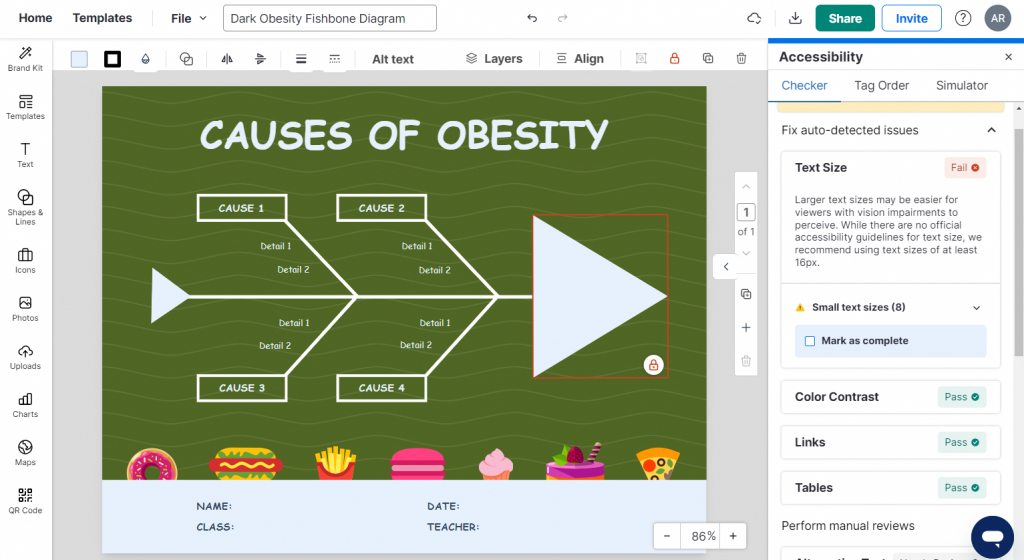
In my case, I still need to increase the text size to make this design accessible.
Another cool thing you’ll find in Venngage is our in-editor library of thousands of free, professional icons, plus diverse icons, and images that you can insert.
Don’t like those fast-food icons at the bottom? Just select them to delete or
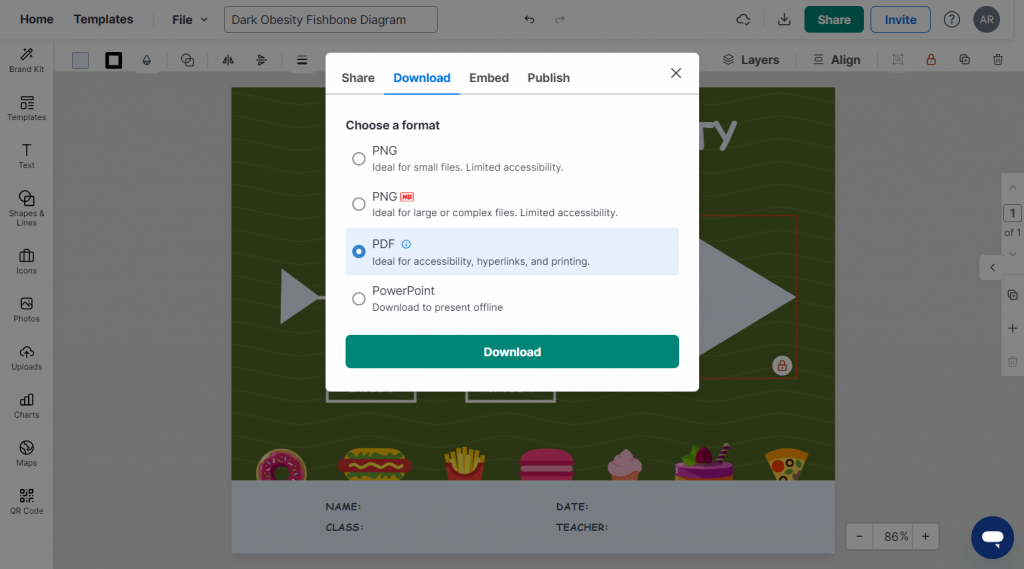
Step 4: Share your fishbone diagram or download it
Once you’re happy with your fishbone diagram, you can share a link to it (available to all users).
If you want to download your fishbone in formats like PNG, PDF, upgrade to a Business account.
Additionally, with a Business Plan, you’ll get access to My Brand Kit, which lets you apply brand colors to your designs with one click.
Conclusion: Don’t waste your time creating tacky Excel fishbone diagrams. Use Venngage instead to add a professional touch
Do you really want to waste your time and energy trying to learn design skills just to make passable fishbone diagrams in Excel when there’s a much better option available?
Edit our professional fishbone diagram templates that you’ll be proud to share today. And who knows, maybe you’ll even get a promotion by diagrams that lead to innovation and change in your company.


