


Have you ever slogged through a report full of raw numbers, with no meaningful charts or graphs to guide you along?
Or maybe you’ve been handed one that does have some charts but… that’s it? No images, no icons, no illustrations — the whole document is way too dense to keep your focus, and you can’t really tell what the point of the report is?
If you’ve experienced the pain of reading dull content, you know having a well-designed report with engaging data visualizations can really make a difference.
And in order to create a good report like this, you need the right report creator.
So in today’s blog, I’ll be discussing the five best report creators you can use in 2024, including tips to help you design the best report possible. Let’s get started!
Venngage
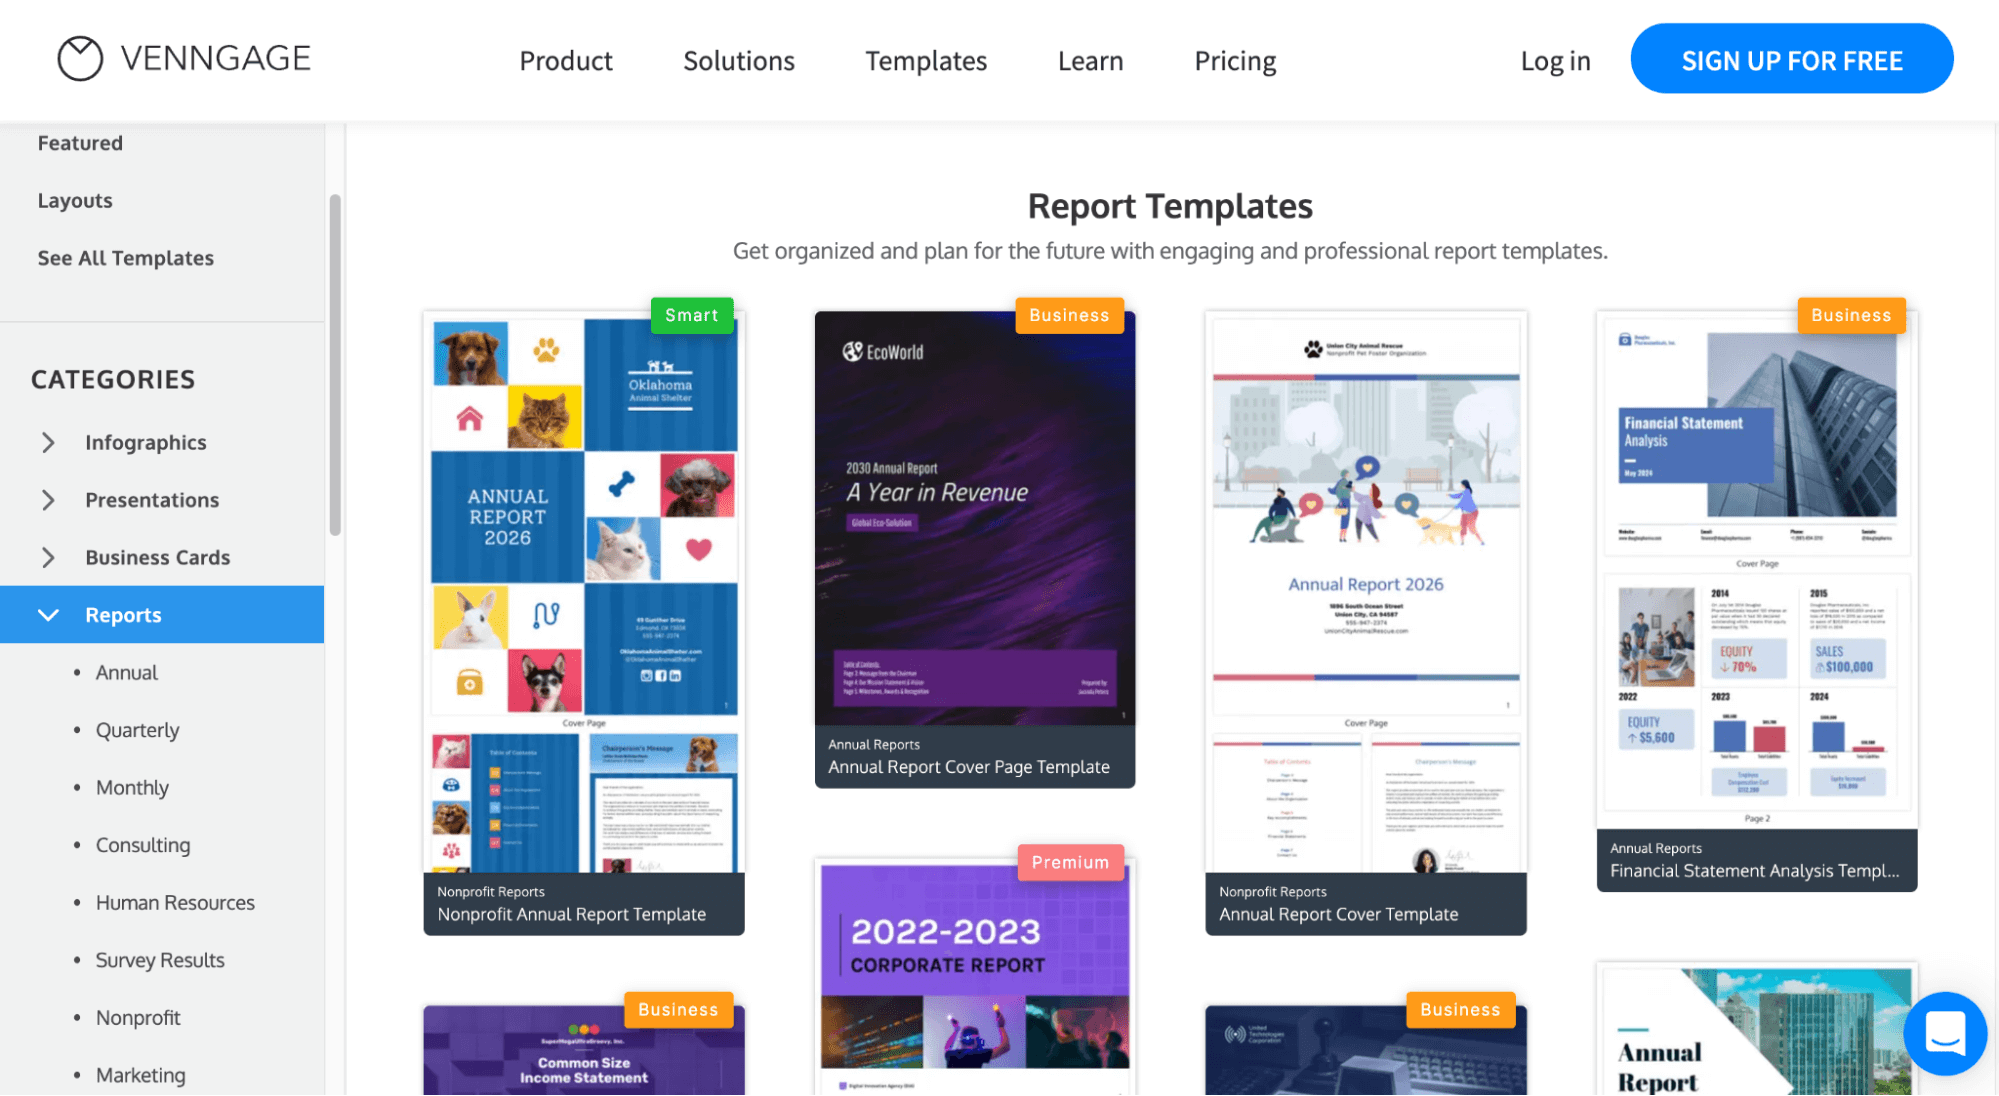
Venngage is a report creator that allows you to create compelling reports for your business or clients, even if you don’t have design experience. Venngage offers report templates of all formats — one-pagers or multi-pagers — so you can create your annual reports, consulting reports, nonprofit reports, marketing reports, survey result reports, case studies and more.
Here’s an example of a Venngage business report template:

You can immediately see that Venngage’s templates are friendly for non-designers: all these templates come with meaningful content and visuals to help guide your design. Each template puts your report data in the spotlight, making your report easy to read while still full of actionable, valuable content for your boss or your clients.
It’s easy to design a report with Venngage:
- Sign up for a free account using your email, Facebook or Gmail
- Choose a report template from Venngage’s template library
- Copy and paste your text content into the report and edit it using the drag-and-drop editor
- Add images, icons, illustrations or data visualizations like charts, graphs and diagrams as you like
- Download in multiple formats (PNG, PDF, Interactive PDF, PowerPoint or HTML)
Features
Besides the professional, fully customizable templates and the easy-to-use editor, Venngage also comes with great features that can benefit you and your team while creating your report:
- Autobrand allows you to have your brand colors and logo automatically uploaded to your Brand Kit:

Which you can later apply to your report in one click:

- You can add your teammates to your workspace and share your report designs with them easily. Multiple download options available (PDF, Interactive PDF, PPTX — so you can present your report on PowerPoint or Google Slides):
- Real-time collaboration allows you and your colleagues to work on a report together. You can make changes, add comments and reply to teammates’ feedback easily, all in real time:

With these features, Venngage is best for:
- Individuals who want to create engaging and professional business reports quickly and easily
- Small businesses with limited resources
You can start designing reports with Venngage for free — this plan offers five designs, six image uploads and access to free icons/illustrations and widgets.
For unlimited designs, access to premium icons and widgets, PNG/PDF exports and more, you can subscribe to the Premium plan for as low as $16/month.
To access team-supporting features like real-time collaboration, branding, more exporting formats, workspaces to add team members and more, you can subscribe to the Business plan for as low as $39/month. (Less than the cost of a coffee per day!)
Google Sheets

I’m assuming you’re no stranger to using Google Sheets (or even if you’re not that familiar, chances are you’ve used Excel — which is kind of the same thing).
A stable of document creation programs, Google Sheets is a spreadsheet application that comes with a variety of templates for reports. Google Sheets report templates tend to be quite simple and straightforward, like this one:

Google Sheets is easy to use and has a wide range of integrations, making it a great option for individuals looking for an affordable report maker. You can also use the platform to create simply graphs and charts to include in your reports.
Features
Google Sheets offers the following features:
- Create graphs and charts to add visual elements to your reports and presentations
- Use the Sheets add-ons feature to access additional tools to help with your reporting needs (for example, there’s an add-on that allows you to compare dates and times to help you analyze data, historical records, etc.)
- Synchronize your spreadsheets with other users so they can access and edit reports anytime
With these features, Google Sheets is best for:
- Individuals who want a more affordable option than industry-specific report creator programs
- Businesses with limited resources and want an affordable, simple report creator option
Of course, Google Sheets isn’t a dedicated report maker — which means it lacks features and functions that help make a report engaging and easy to read. It’s also not as intuitive to use — there’s a bit of a learning curve when it comes to spreadsheet applications like Google Sheets.
But as long as you have a free Google account, you can use Google Sheets as a free report maker. You may also opt for the Google Workspace Business Starter plan at $4.20 a month.
Flipsnack

Flipsnack is a report design program dedicated to creating paper flip documents. You can create a new report from scratch using Flipsnack’s report templates, or upload a PDF to into Flipsnack to transform it into a paper flip document.
This means you can use this program alongside other report makers like Venngage — you can design your report in Venngage, and upload the PDF version to Flipsnack if you want to make a flipbook out of it.
Here’s an example of a report template in Flipsnack:

Features
Flipsnack offers the following features:
- Create reports with different layouts (one-page or two-page spread) and styles
- Convert PDFs into page flip books
- Add images, audios, videos etc. to your reports
- Download reports in PNG, JPG, PDF formats
With these features, Flipsnack is best suited for:
- Businesses looking to have reports in page-flip format
- Businesses looking to add interactive content (like audios, videos, forms etc.) to their reports
Pricing
Flipsnack uses the freemium model: you can try the tool for free for 14 days or with a paid subscription.
The free plan (or period) is pretty limited: you have access to 3 catalogs with up to 30 pages/catalog, and you can share the link to your design but can’t download it.
Flipsnack offers a Starter plan at $14/month, a Professional plan at $35/month and a Business plan at $79/month (with added features for businesses like team management and multiple users).
FlippingBook
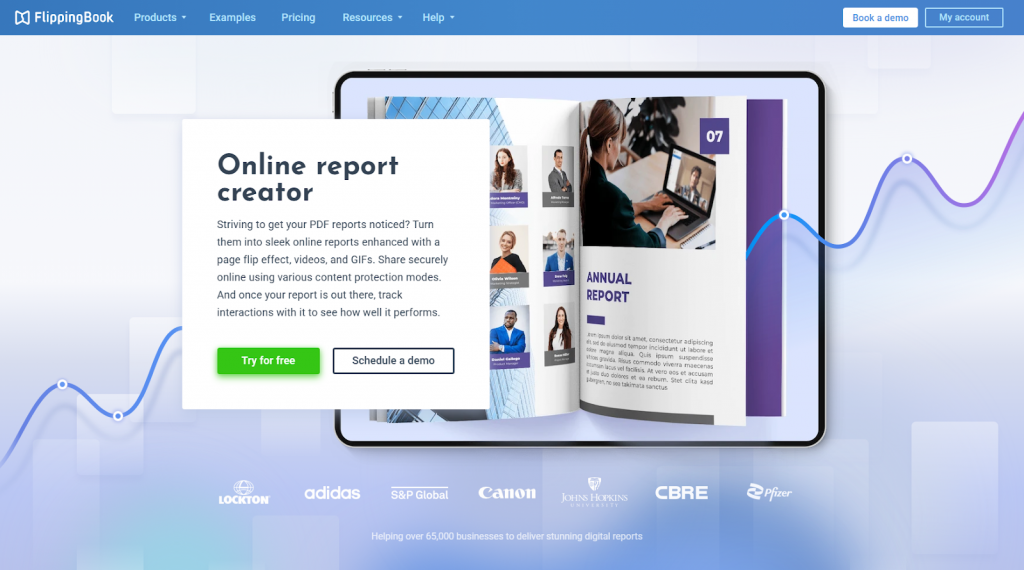
FlippingBook is a powerful tool that transforms static PDFs into professional, interactive flipbooks you can easily share and track. It lets you create online reports with a realistic page-flip effect, embedded videos, GIFs and clickable elements, making your content more engaging and memorable. Once your report is published, you can track interactions to see how well it performs.
Here is an example of an online report created with FlippingBook:
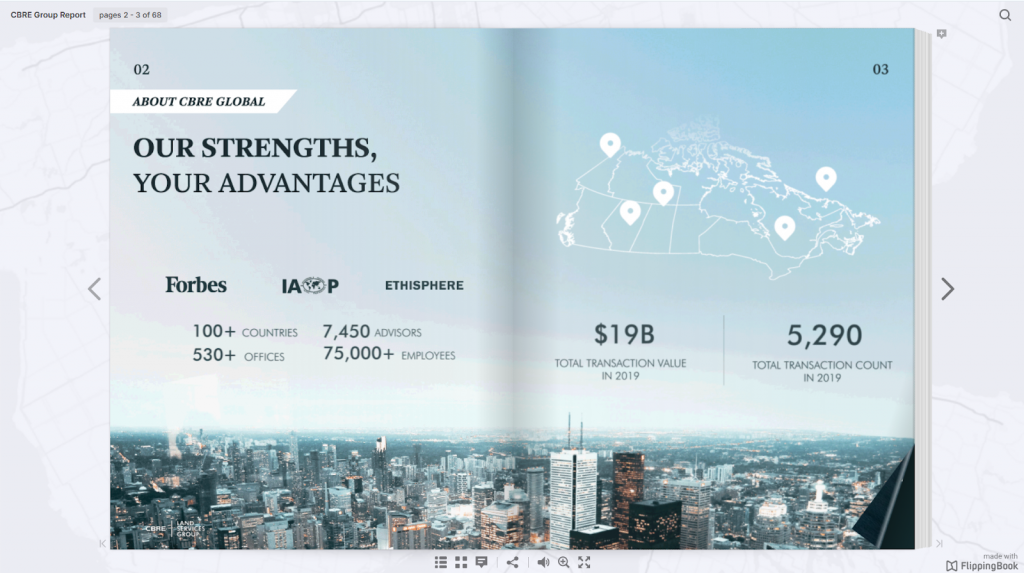
You can convert any report, brochure, newsletter, magazine or other document into an immersive page-flip experience with an authentic, book-like feel. Enhance your flipbook with videos, pop-ups, GIFs, image galleries, and links, then instantly share it with your audience via a direct link.
Features:
- Multiple sharing options: Share your report via a direct link, embed it into your website, or distribute it with a QR code.
- Brand customization: Make your online reports part of your brand by adding a clickable logo, linking to your website, and customizing the report URL for a more professional look.
- Content control and security: Password-protect your document, limit sharing and access permissions, update content anytime without resending links, or take the publication down if needed.
- Interactive enhancements: Bring charts and diagrams to life with GIFs, embed explainer videos, and add links or pop-ups with additional content to make your annual reports more informative.
- Performance analytics: Access 10+ metrics to evaluate views, reading time, clicks, and overall engagement.
With these features, FlippingBook is best suited for:
- Businesses that need engaging, interactive reports accessible on any device
- Companies looking to turn reports into lead generation tools
- Marketing and communications teams that want trackable, shareable content
Pricing:
FlippingBook offers several pricing plans starting from $26 per month, allowing users to choose an option that fits their workflow and collaboration needs.
A 14-day free trial (no credit card required) lets you explore the core features before committing. Annual billing offers additional savings, making the platform more cost-effective for long-term use.
Infogram
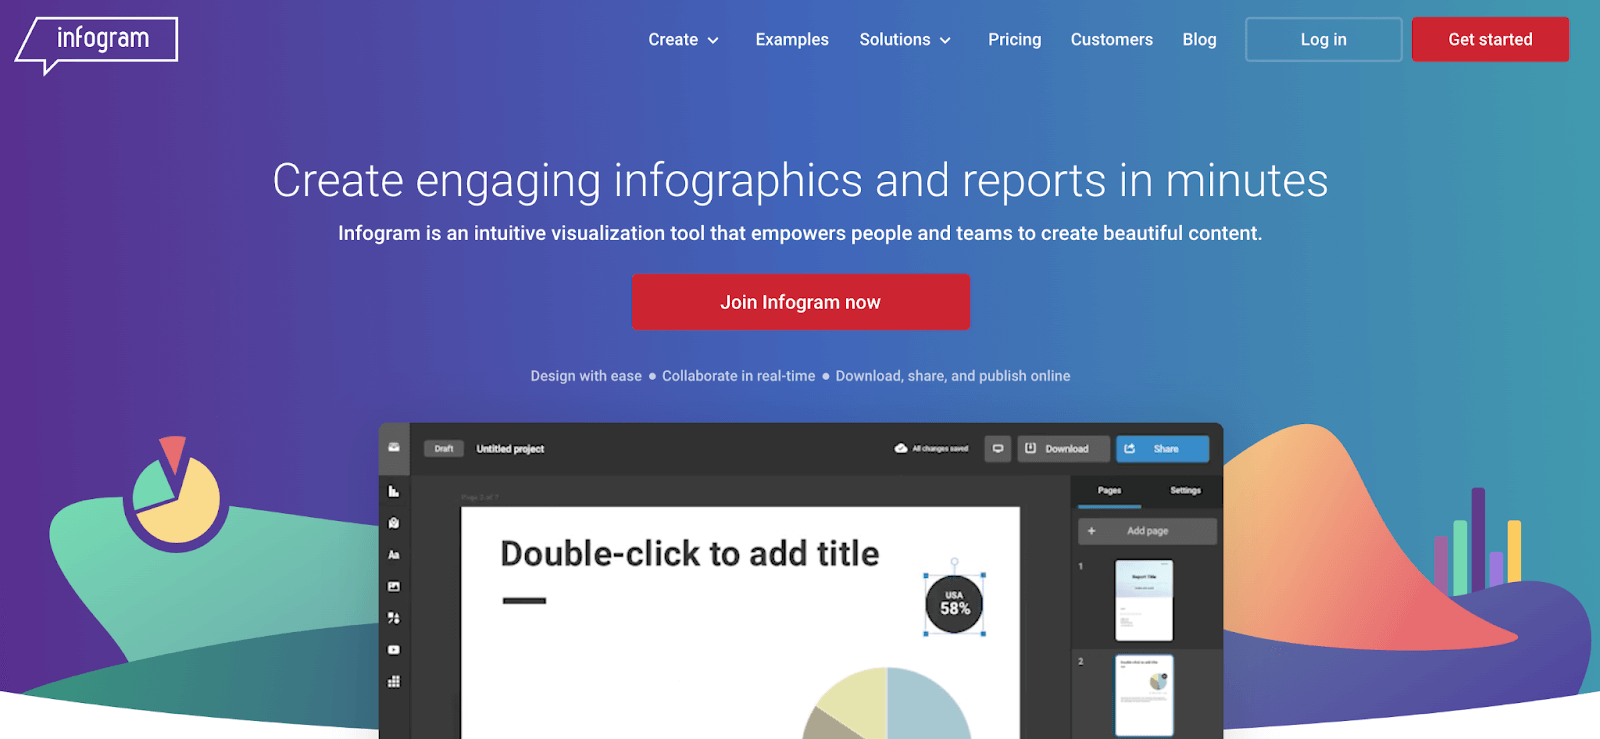
Infogram is an infographic and report creator that provides simple report templates for businesses. Infogram offers quite a few report templates but they’re not categorized, so it could be hard to find the right template for your purpose.
Plus, some of the templates featured on Infogram are sourced from other websites or aren’t available — so it’s not guaranteed you can edit any report template you find on Infogram.
Here’s an example of a report template by Infogram:

Features:
Infogram offers the following design features:
- Easily customize your reports by choosing from a wide range of customizable templates
- Add elements, icons, illustrations and videos to your reports
- Upload your own images and graphics to use in your report designs
With these features, Infogram is best for:
- Individuals looking for an easy way to design reports
- Businesses looking for a variety of templates with minimal design options
Pricing
With the free plan, you can work on up to 10 projects simultaneously with up to 5 pages per project.
Infogram’s lowest paid plan is at $19 per month on a yearly basis, but if you want to get access to business features like branding, you’ll need to subscribe to the Business plan at $67/month (billed yearly). For companies who want more seats and team management features, the plan starts at $149/month.
Piktochart

Piktochart is a report creator which currently offers 63 report templates in these categories: business, dashboard, research, and weekly-monthly-quarterly. Here’s an example of one:

Features
With Piktochart, you get the following features:
- Easy-to-edit report templates over four categories
- Drag-and-drop online editor so non-designers don’t have trouble creating reports
- Multimedia uploading capabilities to create more dynamic reports
With these features, Piktochart is best suited for:
- Individuals who want to create simple reports and don’t need too many options
- Businesses that need basic design options to create reports
Pricing
Through Piktochart’s free plan, you get up to 5 projects, 100 MB of storage and can have up to 4 users. The Pro plan starts at $14/month per member (billed annually) and offers unlimited projects, unlimited folders, 100 GB of storage and up to 25 members.
Publuu

Flipbook Maker from Publuu is an advanced online tool that transforms static PDFs into dynamic, interactive flipbooks with realistic page-turn effects. Whether you’re creating digital brochures, catalogs, presentations, or reports, Publuu helps you captivate your audience with visually stunning and engaging content.
Here’s an example of an interactive Publuu report:

Creating a flipbook with Publuu is straightforward:
- Upload your PDF document.
- Customize your flipbook by adding multimedia elements and adjusting the design.
- Share your flipbook via a link or embed it on your website, and track viewer engagement with real-time analytics.
Features
- Brand Customization: Tailor your flipbooks with your logo, colors, and brand elements to create a cohesive, professional look.
- Multimedia Integration: Enhance your flipbooks with embedded videos, images, and audio to make your content more interactive and engaging.
- Real-Time Analytics: Track viewer engagement and interactions with your flipbooks, providing valuable insights into how your audience consumes your content.
- SEO and Sharing Options: Publuu flipbooks are optimized for search engines, and you can easily share them via a direct link or embed them on your website.
Publuu is perfect for businesses, marketers, and educators who want to create professional, interactive digital documents that engage and inform their audience. Whether you’re producing marketing materials, educational content, or corporate reports, Publuu offers the tools to make your content stand out.
Pricing
Publuu offers a free trial to get started. For advanced features like full branding, multimedia integration, and detailed analytics, annual plans start at $7 per month, and monthly plans start at $14 per month, making it an affordable option for businesses of all sizes.
Coupler.io
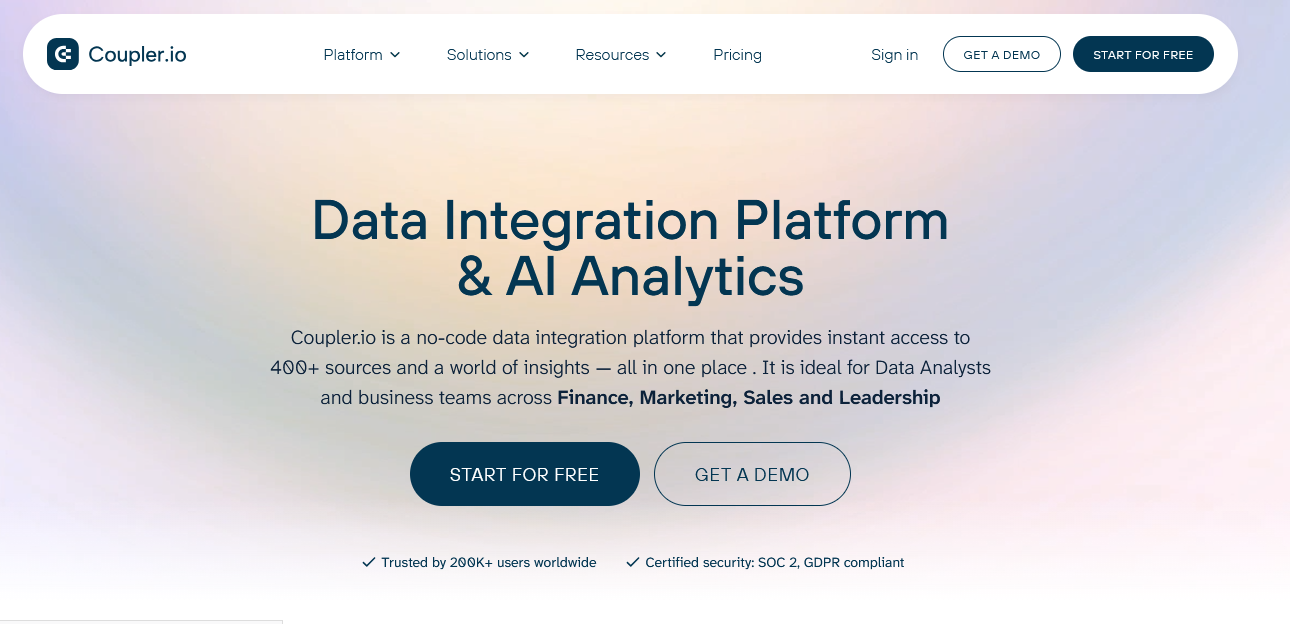
Coupler.io is a reporting automation platform that turns complex data into insightful reports. Without any coding, you can bring marketing, sales, and finance data to your data warehouses, BI tools, and spreadsheets. Coupler.io allows you to collect, organize, and visualize data to make data-driven decisions. Over 100 pre-built and automated reporting dashboard examples from Coupler.io’s gallery will help you get started.
Features
Coupler.io offers the following features:
- Easily collect and combine data from the apps you use, no coding needed
- Organize and transform your data
- Get ready data to build insightful and automated dashboards using pre-built templates or from scratch
- Access data that is always up to date by enabling refreshing data
With these features, Coupler.io is best suited for:
- Marketers looking to automate monitoring of their marketing performance
- Accountants and finance audience wanting to eliminate manual data copy-pasting and minimize human errors in financial analysis with Coupler.io.
- Sales teams looking to amplify the analysis of your sales pipeline at every stage & get insights from multiple sources in a live dashboard
Pricing
Start using Coupler.io with 7 free days on the team plan. After that, pick the plan that fits you best or stay on the free plan. Keep in mind that all sources and destinations are available on every plan.
Tips for designing a report in 2024
So you’ve known about the best five report creators you can use for your business — now’s the time to learn how to create an engaging report that won’t leave your boss or client feeling bored. Here’s some tips to help you do that:
Create a clear and concise report
What exactly do I mean by a “clear and concise” report?
This means avoiding long blocks of text and breaking up information into easy-to-read sections. You can also visualize your data using graphs, charts and diagrams. This helps improve the report’s readability, making it easier for your audience to grasp the content.
Speaking of data visualizations…
Include relevant visuals
Besides visualizing your data, you can add illustrations like images or icons to your report to liven it up. Images and icons can help make a report less dense and boring, thus keeping your readers engaged. This is a good example of a report that does exactly that:

Brand your report
A report is a great way for a business to showcase their thought leadership in their industry. So don’t miss the opportunity to make your report reflect your brand and stand out in the mind of your target audience.
You can easily add branding elements to your report design when using Venngage. Autobrand loads your brand colors and logo automatically to your Brand Kit. Then, you can brand your designs in just one click!

Use a report template with an online report creator
It can be hard to create a valuable and engaging report at the same time — and for some businesses, it can be costly to hire a designer to design a report, and time-consuming to take on designing a report from scratch using difficult tools like Adobe InDesign.
So if you want your report to be professional looking while still engaging your reader, your best bet is to use a report template from a reliable report creator like Venngage. A well-designed template and a good editor can save you tons of time by giving you a starting point, helping you plan your report layout, choose design elements and more.
Engage and impress with Venngage’s report creator
Don’t bury your data under heaps of text and boring report layouts! Make sure your report really delivers by designing it with Venngage.
With a wide variety of fully editable report templates, an easy-to-use editor and tons of useful features to help you design your best report (while working with your team!), Venngage helps simplify the report creation process and allows you to get your point across faster.
The cherry on top? It’s free to get started.


