


Do you need to create an organizational chart for your company but aren’t sure where to begin?
One option is to use Microsoft PowerPoint. It isn’t the easiest tool to use, but you can make some org charts with it.
In this guide, I’ll show you how to create organizational charts in PowerPoint and then reveal a much easier way using Venngage’s Organizational Chart Maker.
Want to save time creating an organizational chart? Venngage has a library of organizational chart templates that anyone can use.
Click to jump ahead:
- How to create an organization chart in PowerPoint?
- The pros and cons of creating an organizational chart in PowerPoint
- How to create better organizational charts with Venngage
How to create an organizational chart in PowerPoint
Creating an org chart in Microsoft PowerPoint is simple.
The built-in SmartArt tool allows you to edit templates, add shapes, and format elements.
Here are the steps to create an org chart as a SmartArt graphic:
1. Select a template
Open a blank document in Microsoft PowerPoint and click SmartArt under the Design tab.
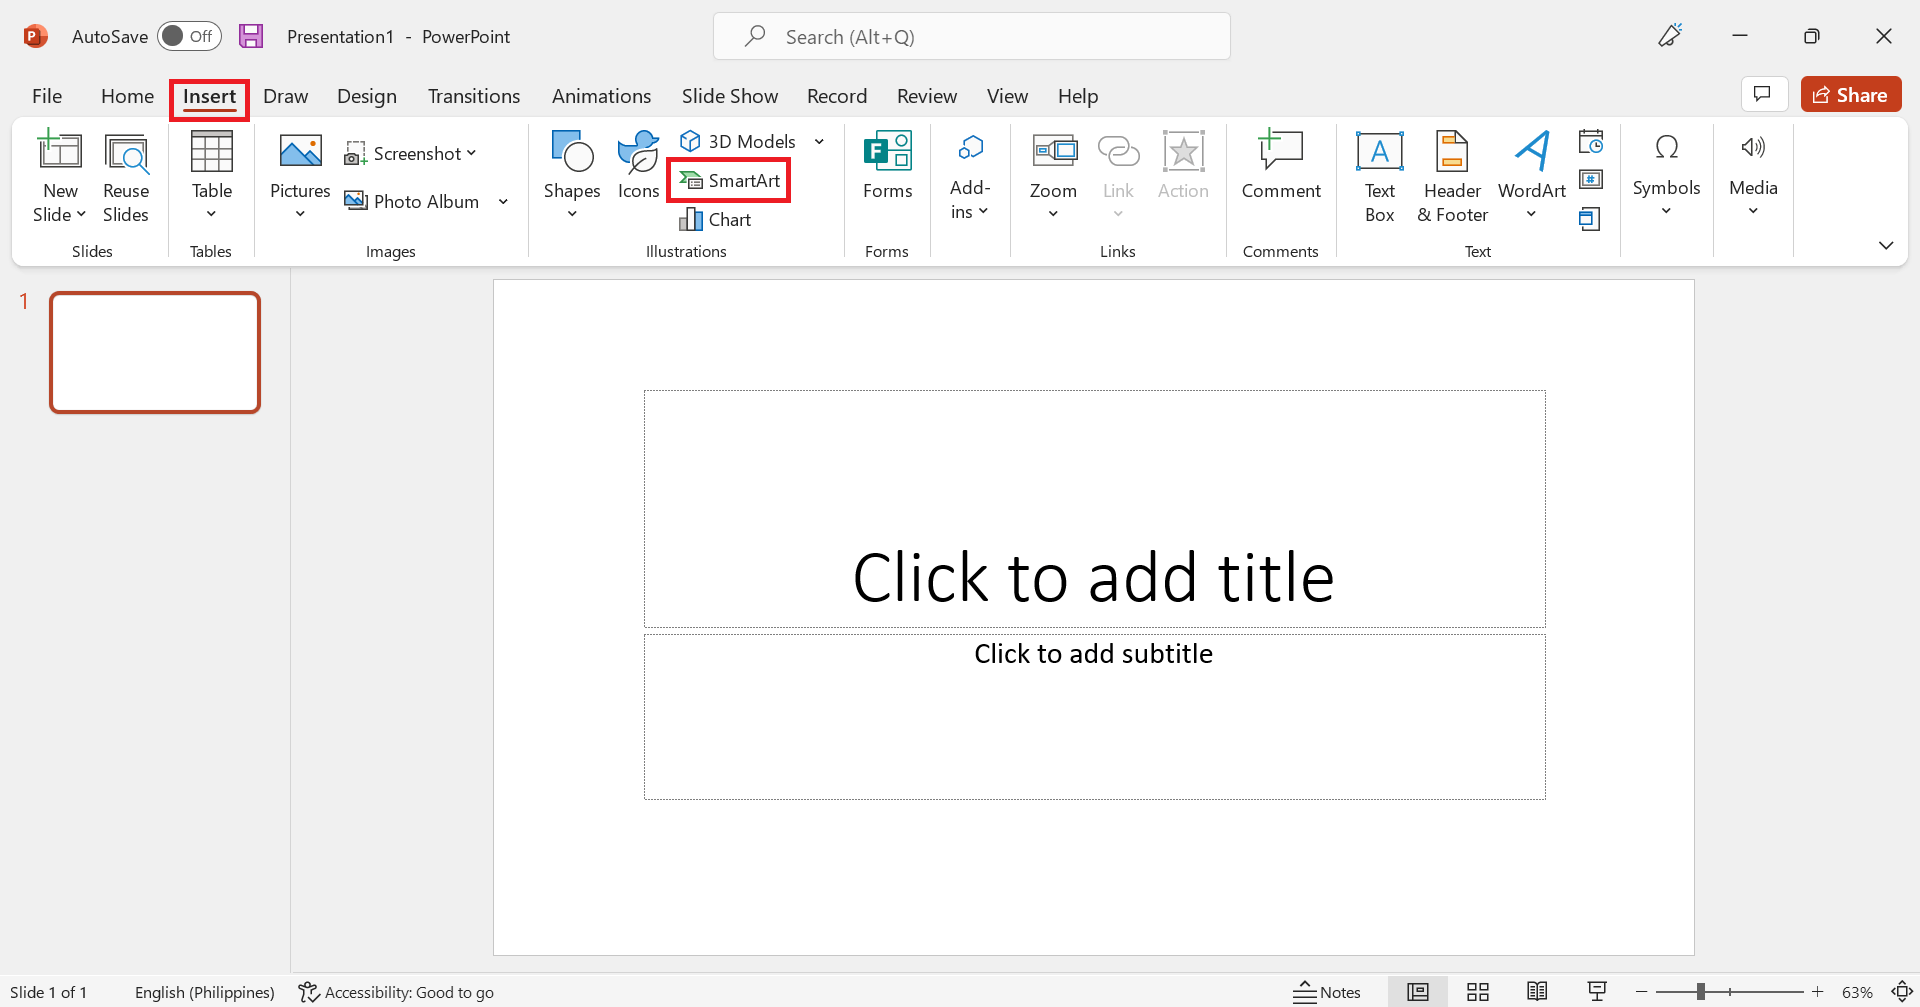
You should see a popup window where you can select a SmartArt graphic.
There should be several templates to pick from under Hierarchy.
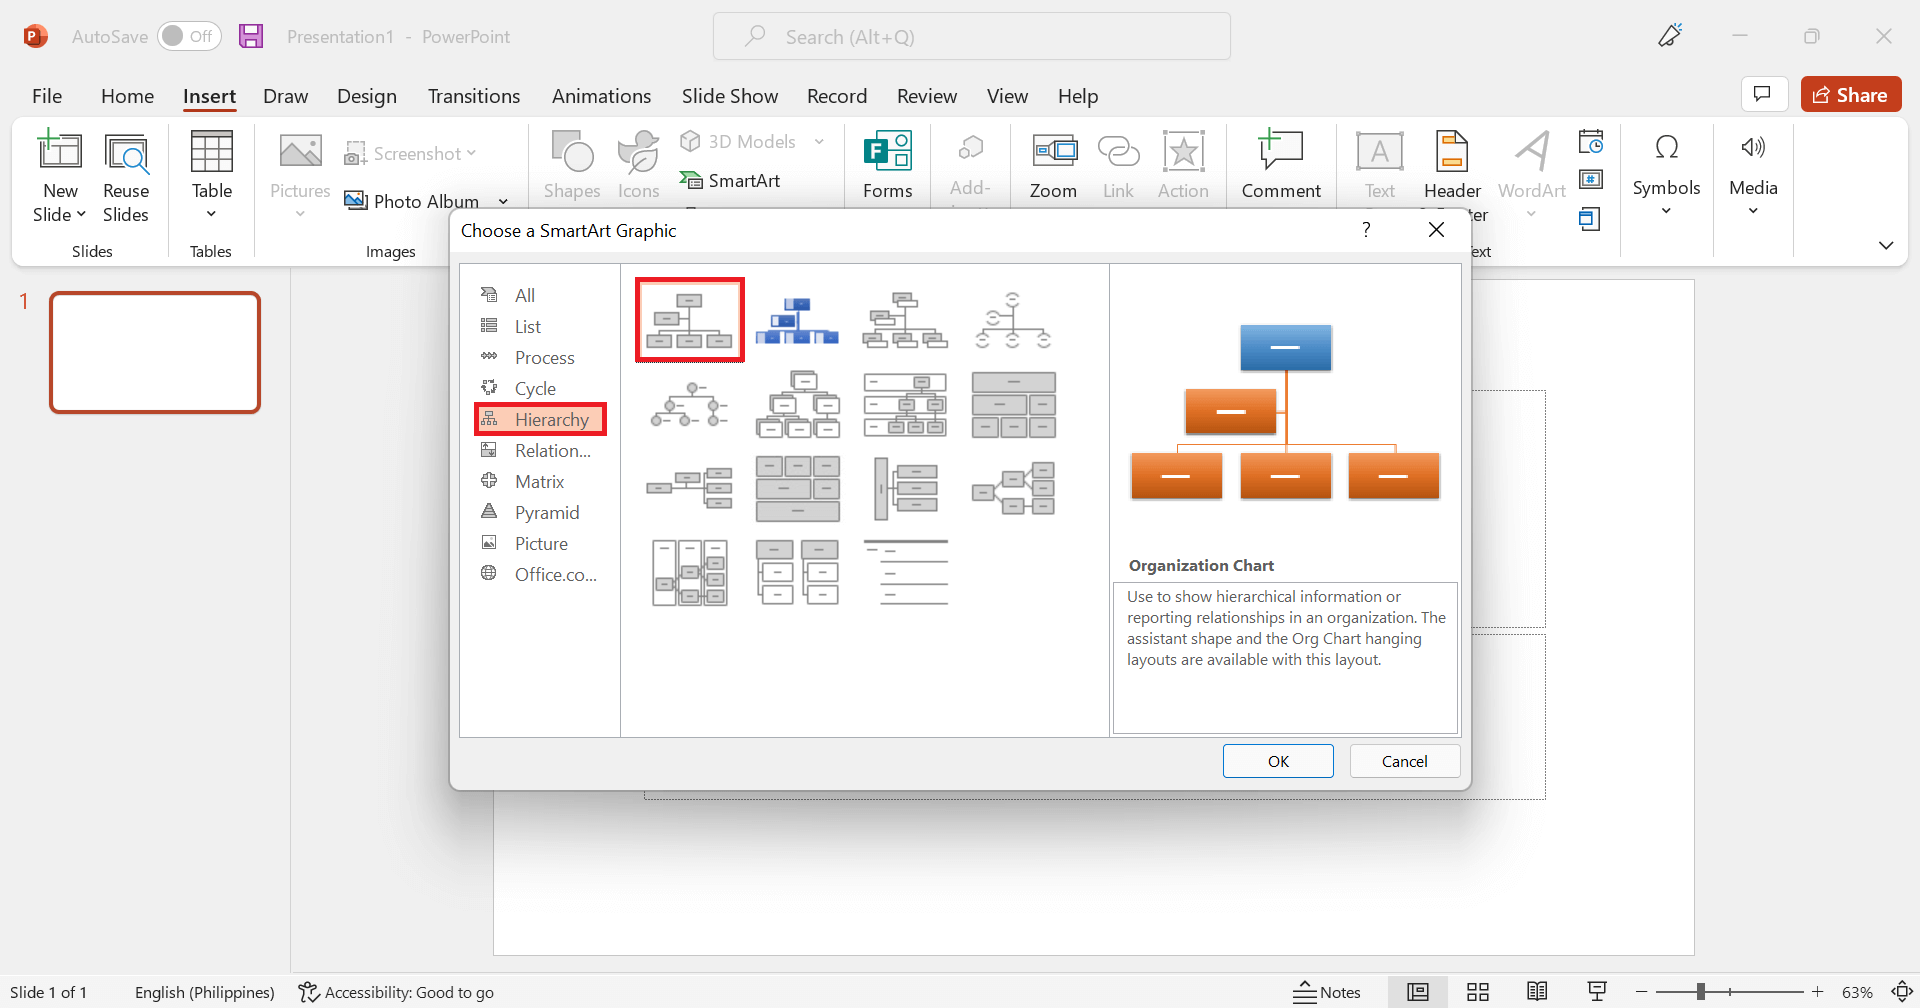
Select “OK” to insert the org chart into the canvas.
2. Change the font style and size
Large sans-serif fonts are used in organizational charts because they can be read by everyone.
If your org chart becomes too crowded, you may need to reduce font size while keeping legibility.
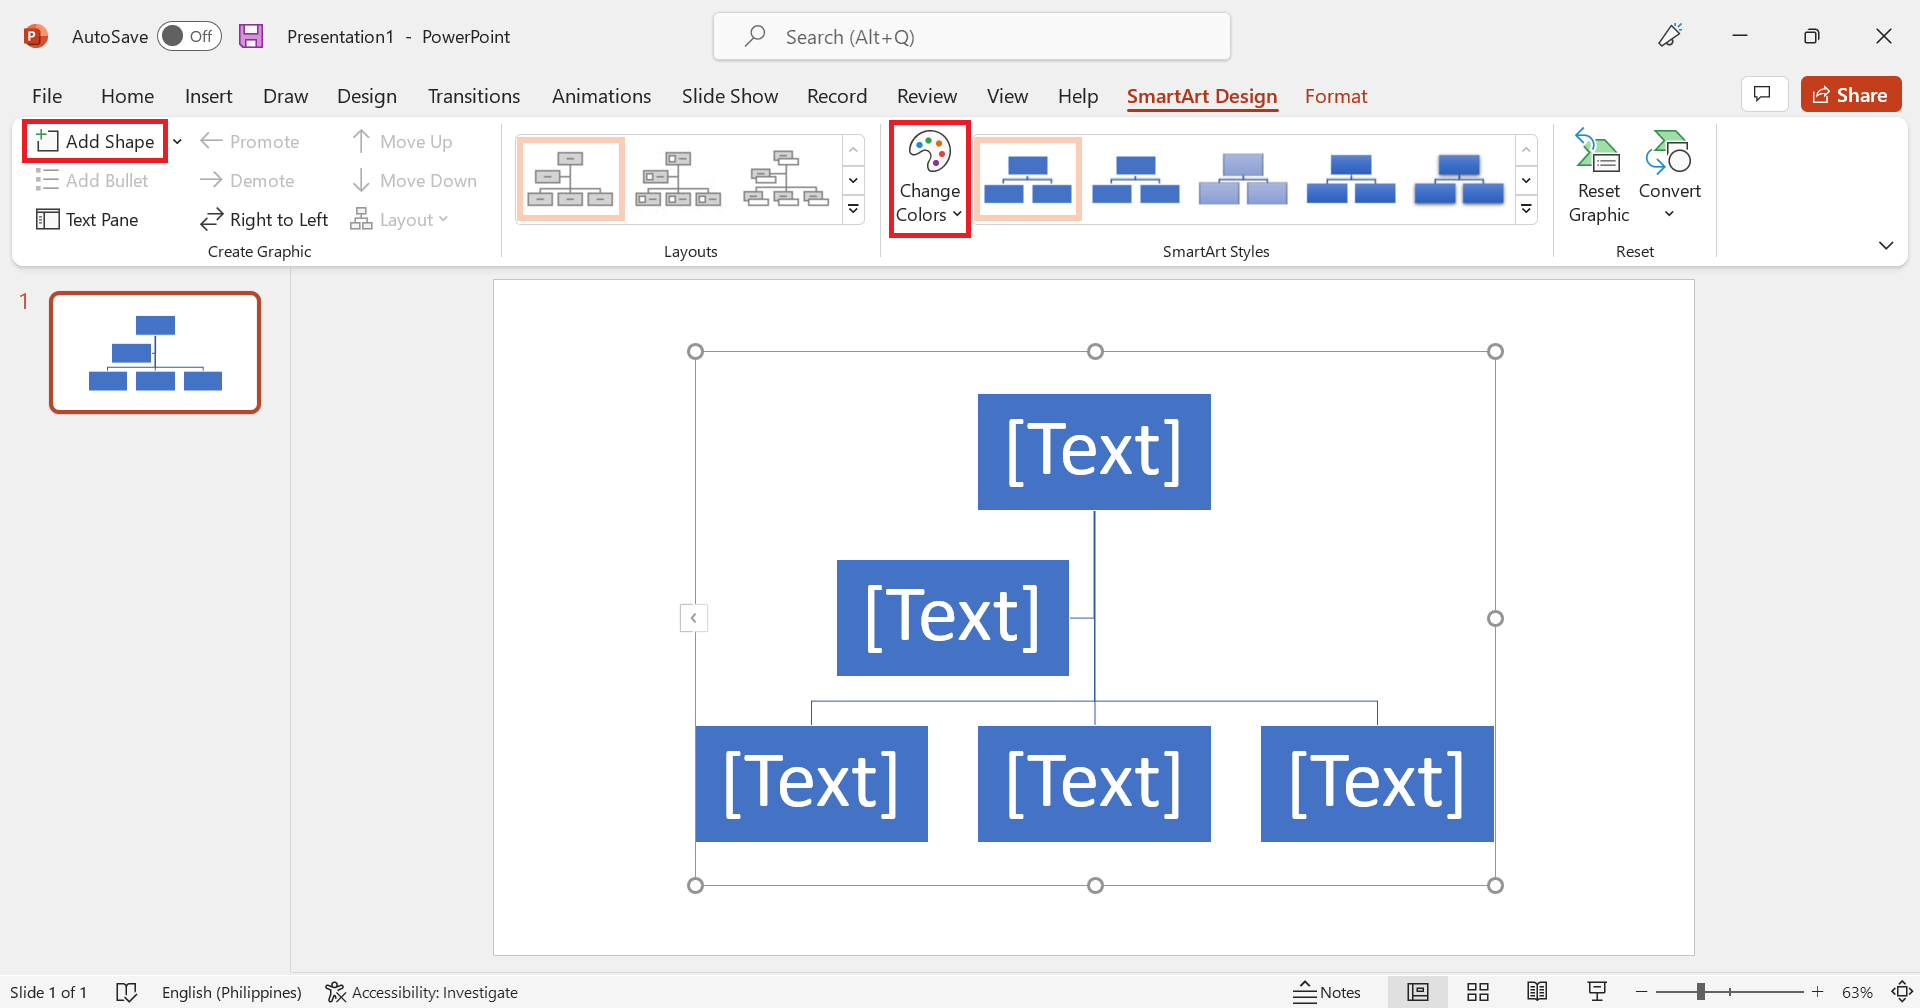
3. Edit the chart
The SmartArt Design tab gives you options to insert a new shape or add more shapes, and alter the title position, font color, and name order, among other things.
4. Insert pictures or icons
SmartArt Design also has a layout that allows you to insert pictures or icons.
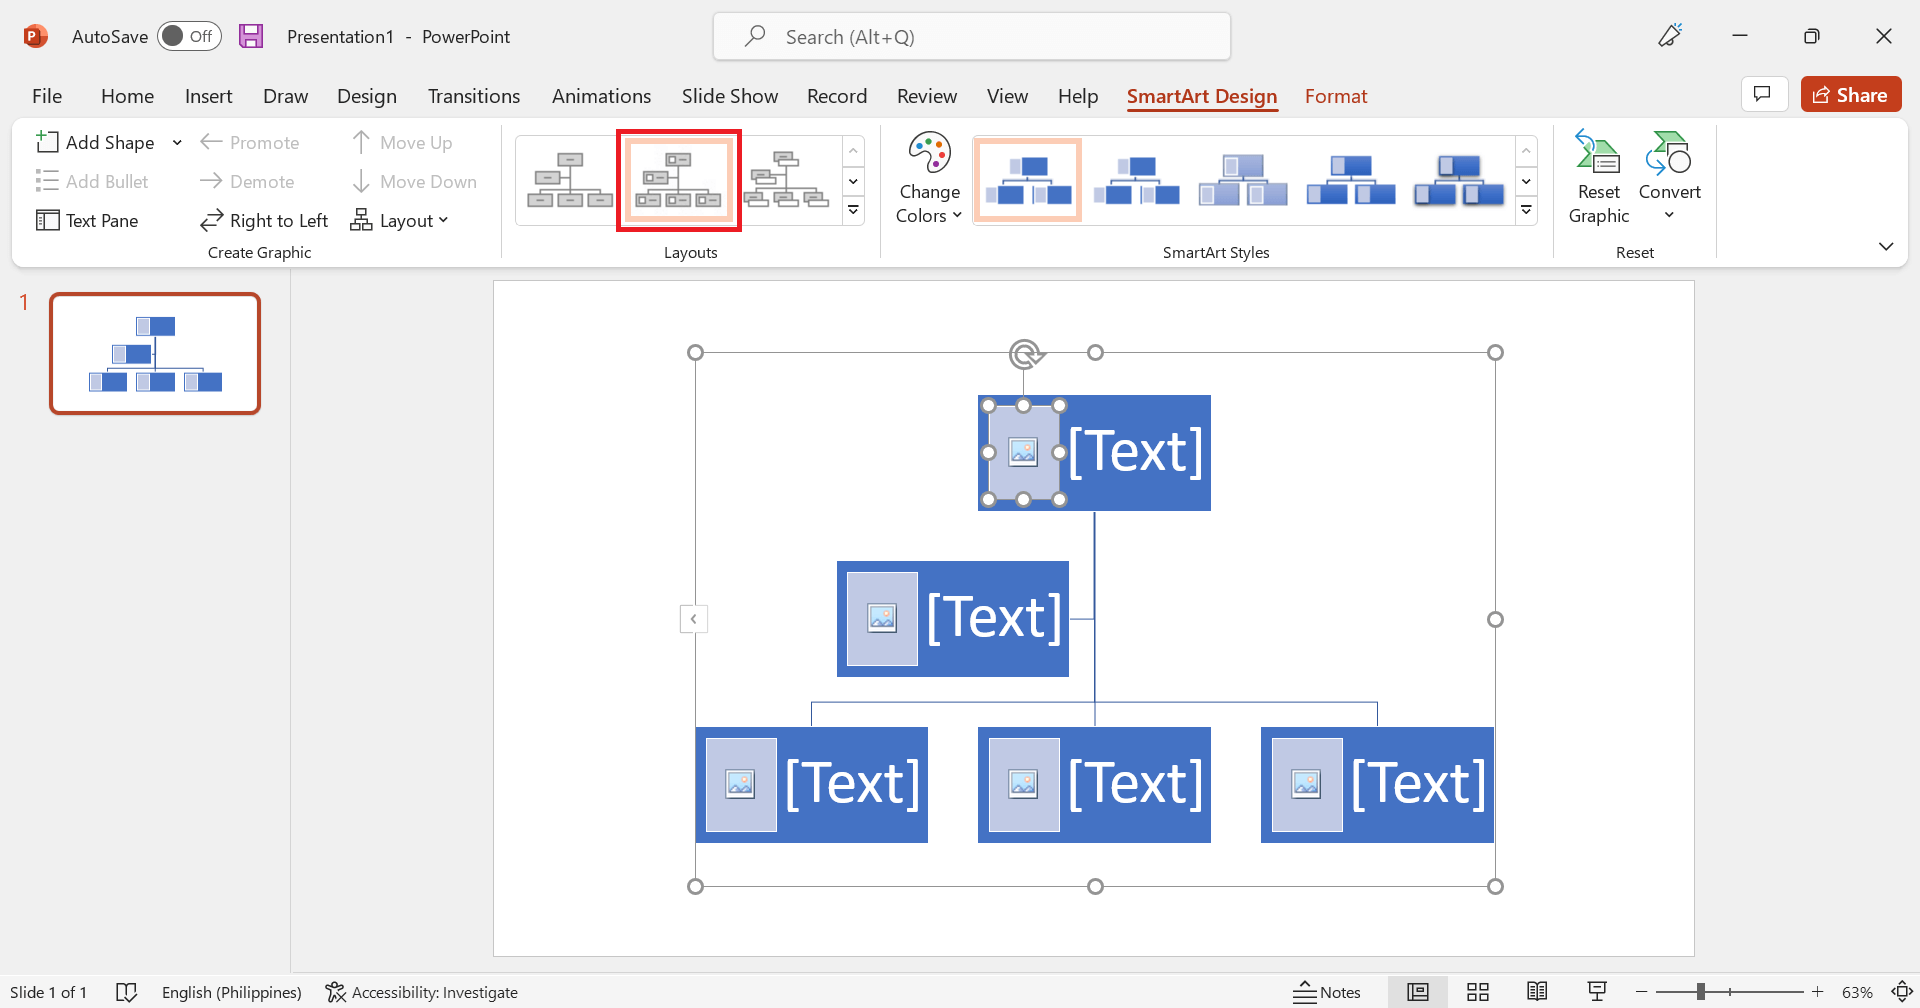
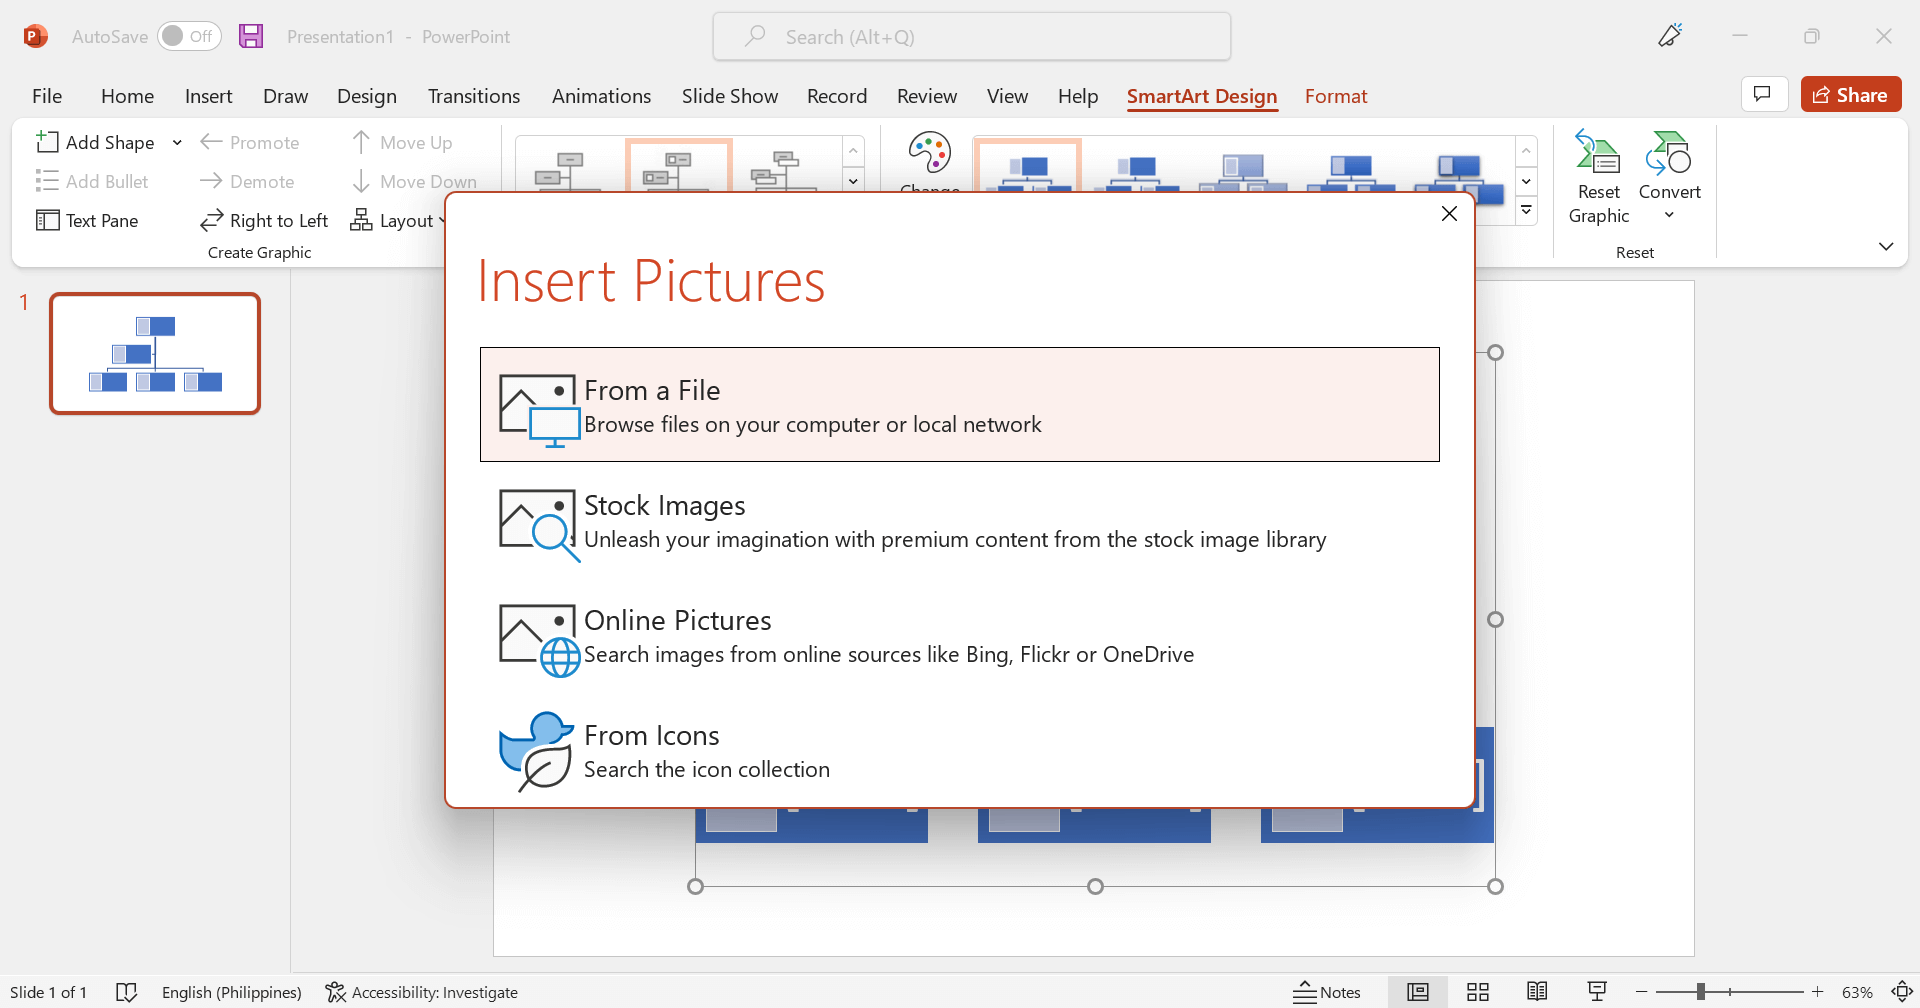
If there are corporations involved, you can include their logo next to the names.
Corporate logos are a significant part of org charts since they make them look more professional.
After you’ve finished your org chart, go to the “File” tab and select “Save” or “Save As”… to save the file.
And that’s it! You’ve managed to create an organizational chart in PowerPoint.
The pros and cons of creating an organizational chart in PowerPoint
For organizational design specialists, creating an org chart in PowerPoint may feel too simple.
PowerPoint creates org charts by allowing designers to insert shapes, text boxes, boxes, lines, and connection points in each layer.
But the process is manual and you’re limited by the shapes available.
Also, due to the various font types and styles utilized, some people find it difficult to create an org chart in PowerPoint. It may also be incompatible with their requirements.
And without individually changing each item, an org chart created in PowerPoint cannot be automatically updated when your organization structure changes.
Additionally, most printers do not accept PowerPoint files, so you will need to convert the chart to a picture before printing.
Pros of creating an org chart in PowerPoint
- Availability: Many simple PowerPoint templates
- Flexibility: The structure of the organization can be manually changed at any time
- Scalability: The organizational structure size can be changed without compromising legibility
Cons of creating an org chart in PowerPoint
- You need to purchase Microsoft Office Suite
- You need experience using PowerPoint or spend time learning the software
- If you don’t use a shape correctly, some organizational layers may link erroneously or appear on more than one layer.
- Instead of using PowerPoint shapes, you’ll have to do most of the design work by hand
Read: 11 Types of Charts and How Businesses Use Them
How to create better organizational charts with Venngage
Making PowerPoint organizational charts in Venngage is a seamless process.
The platform has a variety of organizational chart templates designed by experts for non-designers like in the example below.

You don’t need to download any software because Venngage is an online solution.
You can register for free and begin creating immediately.
To make an organization chart on Venngage, follow these simple steps below:
- Sign up for a free Venngage account.
- On the left-side menu pane, under Categories, click on Diagrams, then Organizational Chart.
- Choose a template that best suits your organizational structure and click Create to get started.
Upgrade to a Venngage for Business account to access My Brand Kit, which lets you add your company’s logo, color palette, and fonts to all your designs with a single click.
A business account also includes a real-time collaboration feature, so you can invite members of your team to work simultaneously on a project.
Now that you know how to create an organizational chart, it’s time to create one using a Venngage template.
Venngage allows you to download organizational charts with an upgraded account.
Once you’re done creating, save the file on your computer by clicking Download in the menu.
You can choose from a variety of download formats such as PNG or PDF. You can also export your chart as a PowerPoint presentation.
In Summary: Make better org charts by using Venngage
An org chart is a simple tool to understand company structure.
It provides clarity on who is responsible for what, allowing for quicker decision-making.
While you can use Microsoft PowerPoint or even Excel, Venngage has a larger library of organizational chart templates, including a plethora of free icons and fonts as well as a user-friendly interface.
All of this makes Venngage the design solution that best accommodates creating professional organizational charts.


