


Data visualization could perfectly define the age we’re living in nowadays. Any news sites we go to are full of graphics, from charts relating one country’s financial status to stats about poverty in the world.
If we look on our phones, the apps that keep track of our sleeping cycle generate graphs to tell us when we sleep best. We find data visualization in almost every aspect of our lives and that’s because putting words and experiences into big data is such a powerful tool!
In 2016, Venngage conducted a survey in which they asked 300 online marketers and how visuals influenced their marketing strategies.
When asked which type of visuals had the highest engagement, 41.5% of marketers said that infographics and other original content were the most engaging.
As Aaron Orendorff said in an interview:
“There’s gonna be and there already is a huge push to visualize everything, create more infographics, more SlideShares, more videos.”
But how can marketers create visuals so they can stand out from the crowd? And how can we get the most out of our visuals?
I believe that there are two simple answers to those questions:
- Create visuals for your audience.
- Optimize your visuals.
There are a few strategies for how to share infographics to get more views, and I’m presenting them to you step-by-step.
1. Use snackable visual content in guest posts

When it comes to snackable content, most marketers have the same reaction: instant goosebumps.
Snackable visual content refers to that piece of visual content that is designed for simple and flexible audience consumption.
While our attention span is shrinking and the amount of content out there is increasing, snackable content is exactly what people need for a fast, on-the-go consumption. It works great on social media and in guest posts as means to amplify other content.
In our case, snackable content’s purpose is to give a glimpse of the infographic and make people want to know more.
What makes a piece of visual snackable?
- Less words (remember that less words doesn’t automatically mean less quality)
- Easy to understand text
- Eye candy design (attractive design which easily catches the eye of the user)
- Colorful (stay true to your brand’s colors)
- Great design elements (high quality images, good colors and contrast on buttons)
- Readable fonts
Dr. Lynell Burmark, Ph.D. Associate at the Thornburg Center for Professional Development, who has written extensively on visual literacy, said that:
“…unless our words, concepts, ideas are hooked onto an image, they will go in one ear, sail through the brain, and go out the other ear. Words are processed by our short-term memory. Images, on the other hand, go directly into long-term memory where they are indelibly etched.”
For example, let’s say that you have an infographic like this one from ReputationDefender Testimonials, and you want more people to see it.
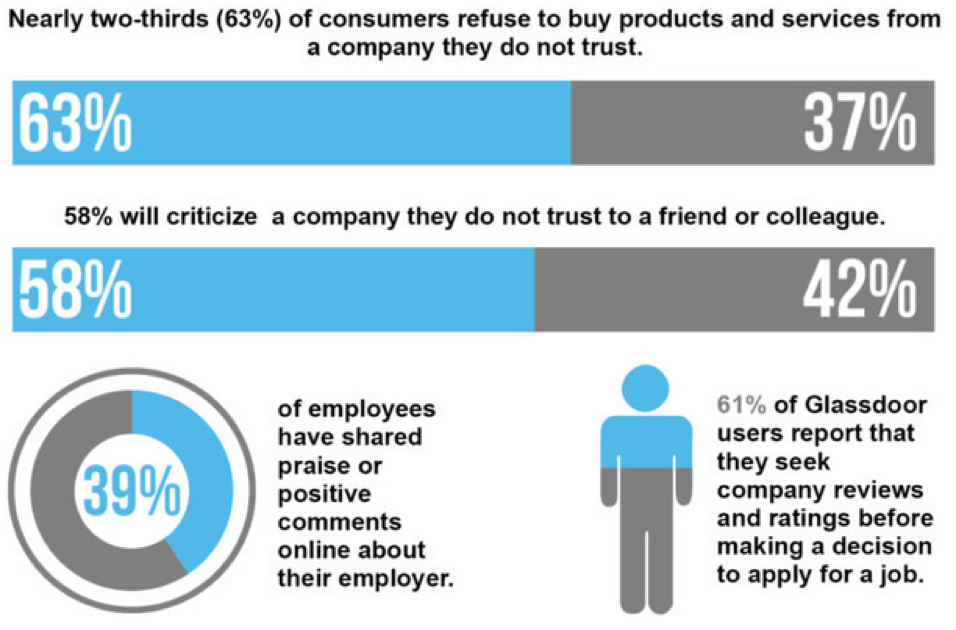
This is why you could use snipped visuals from it when you do a guest post. A snipped visual represents a cropped part of your original visual, which can be reposted on other platforms.
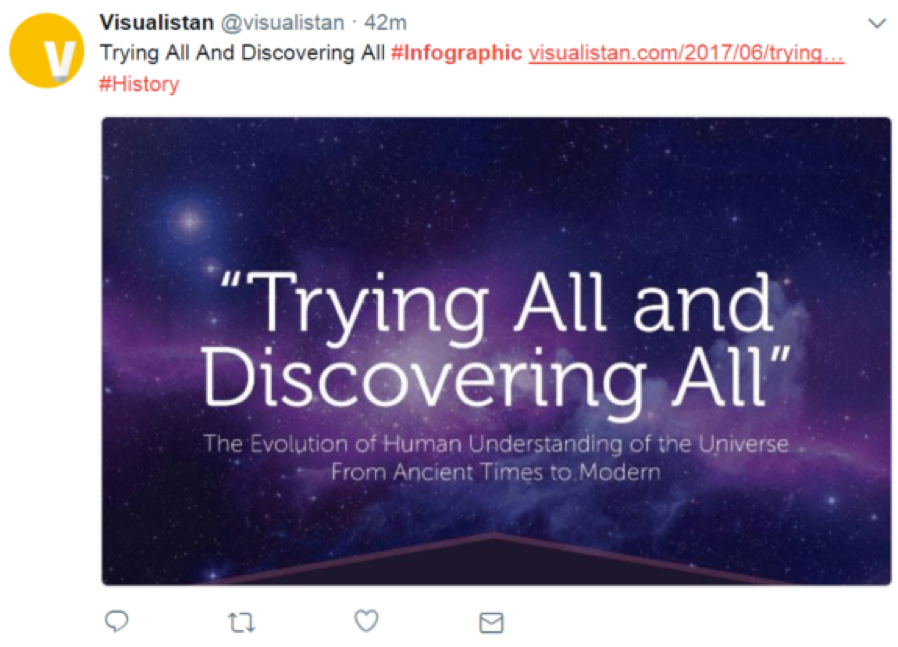
One example of a repurposed infographic comes from Visualistan, an Infographic directory and infographic submission site. They repurpose the first ‘slides’ of their infographics as images for social media, in order to let people know what the infographics are about and what they will look like.
2. Repurpose your infographics on SlideShare

When I first used SlideShare, I wasn’t sure about how powerful this platform can be. Then, it hit me. This is perfect to repurpose infographics!
You know that never ending competition between scroll lovers and swipe lovers, don’t you? No more zooming in and zooming out again.
SlideShare’s goal is “making knowledge sharing easy,” so repurposing your infographic on SlideShare should be a must.
How can you do that? Well, it’s easier than it sounds.
Step 1: Slides are typically 1024 x 768. You might need to leave out parts of your infographic if they don’t fit, or leave explanation that would be useless on a slide.
Step 2: After polishing your visuals, export them as PDF and upload them on SlideShare. If you created your infographic with Venngage, you can easily download it as PDF after finishing it. You can also convert your PDF to QR code if you plan to share it without attachments.
Step 3: Optimize the description in order for it to be easier found by filling in information for title, description, category, privacy and tags.
Step 4: Publish! There you go! Your infographic is now a SlideShare.
Step 5: In the end, don’t forget to link to your SlideShare in your articles and social media posts.
Also, if it’s good enough, there are chances that your content is featured on the SlideShare’s homepage! There are 70 million users on the platform that could see your infographic, then get to your website.
Don’t miss the chance of showing your work to them.
Bannersnack’s been using this strategy for a while now. Below you can see how they repurposed their infographic about The ABCs of Visual Ads That Work into a slide deck.
3. Repurpose your infographic as video

Whenever you decide you want to create an infographic, you have to think about a few very important guidelines.
One of those is settling which social networks you want to promote your infographic on. Of course, you know that the vertical size of most infographics doesn’t fit on 90% of social networks, but that isn’t a problem since you can repurpose your infographic into different formats.
Think about this: according to Adobe, 51.9% of marketing worldwide name video as the type of content with the best ROI.
For example, you can transform your infographic into a branded video. How?
By breaking your infographic into smaller visuals.
If you made an infographic about the coffee consumption in the US, you could easily separate your chapters into smaller visuals and create a slide deck out of them, which you could then post on Facebook or Youtube.
What I’ve been using to do that is Camtasia or Wave, with which you can easily create a video out of photos.
The great part is that you can even add animations on your photos or annotations like callouts or shapes.
Let’s take, for example, this video I found on Facebook.
They are using catchy statistics and information in order to make the viewer curious about the subject and make him or her click the link that redirects to the whole infographic!
Here are the 5 types of video you can create for your social media and you can integrate your infographic data too:
- Documentaries
- Video series
- Webinars
- Live videos
- Snap videos
Quick tip: Create your video 1:1. Why? Because if you create your video with this aspect ratio, it will fit both desktop and mobile so all users can benefit from it. Otherwise, you’re losing one of the audiences.
4. Optimize your infographic for SEO
In order for your efforts to pay off, you need to optimize your infographic and the page you put it on.
The first step in optimizing your infographic is choosing a keyword or keyword phrase to build your content on.

Here are some tactics you could use to optimize your infographic:
- URL: Make sure that your keyword is present in the URL of your post, as search engines use it for ranking.
- Meta description: This description is meant to provide a concise summary of your page and usually it appears underneath the blue links in any search engine results page. Since you only have 160 characters max, make sure that your keyword is part of your meta description.
- Headings and subheadings: Putting your keywords up front in your headings and subheadings not only emphasizes what comes in the content below but it’s also really useful for those that only scan your article to see whether they’re interested or not.
- Image alt text: This is another opportunity for you to incorporate additional text onto your page.
- Loading time: The loading time represents the time it takes to fully display the content on a specific page. From an infographic by Kissmetrics we find out that faster pages both rank and convert better than the ones with slow loading time.
- Social sharing: When it comes to social media, keyword optimization isn’t always that important; clicks rule these platforms. But you should have social sharing buttons since those are important to gaining higher rankings. Make sure you add social buttons to any pieces of content you post on your blog.
Even though the infographic itself is just an image at the end of the day, the text you’re adding to explain your content is extremely valuable since it can push forward your work!
5. Change the language to outreach to international bloggers
One way through which you can get to a larger audience is getting out of your comfort zone. Start thinking about those people that might be interested in your infographic, but don’t speak your language.
If you’re planning to do this, make sure you are working with a really good translator. The effort of translating a piece of content into another language is appreciated, but misspelling words isn’t.
After translating your infographic to another language, start reaching out to bloggers that might help you promote it.
How do you decide which language you should translate your infographic into?
You can use Google Analytics:
Just go to Audience and select “Geo” where you have 2 options: “Language” and “Location”. Choosing “Location”, you can see the top 10 countries from which people are reading your blog or following your website.
This tool can help you choose which language to translate your infographic to.
Key Takeaways:
- Break your content into smaller pieces for easy, on-the-go consumption
- Use SlideShare to reach to a wider audience
- Video has the highest engagement on Facebook, so don’t be afraid to use it
- Choose a really good keyword or keyword phrase for your SEO optimization
- Don’t forget that there might be people who speak other languages out there who might be interested in your content
Using the tactics above will help you get to the full potential of your infographic. That’s what all of us want, right?
Let me know in the comments section below whether you used any of these tips and what other optimization tools are you using.
Want to learn more about creating and sharing infographics? Check out our ultimate guide.


