Dating and relationships can be tricky. With all of the dating app data out there, you would think we’d be able to find some dating stats to help us find our perfect match.
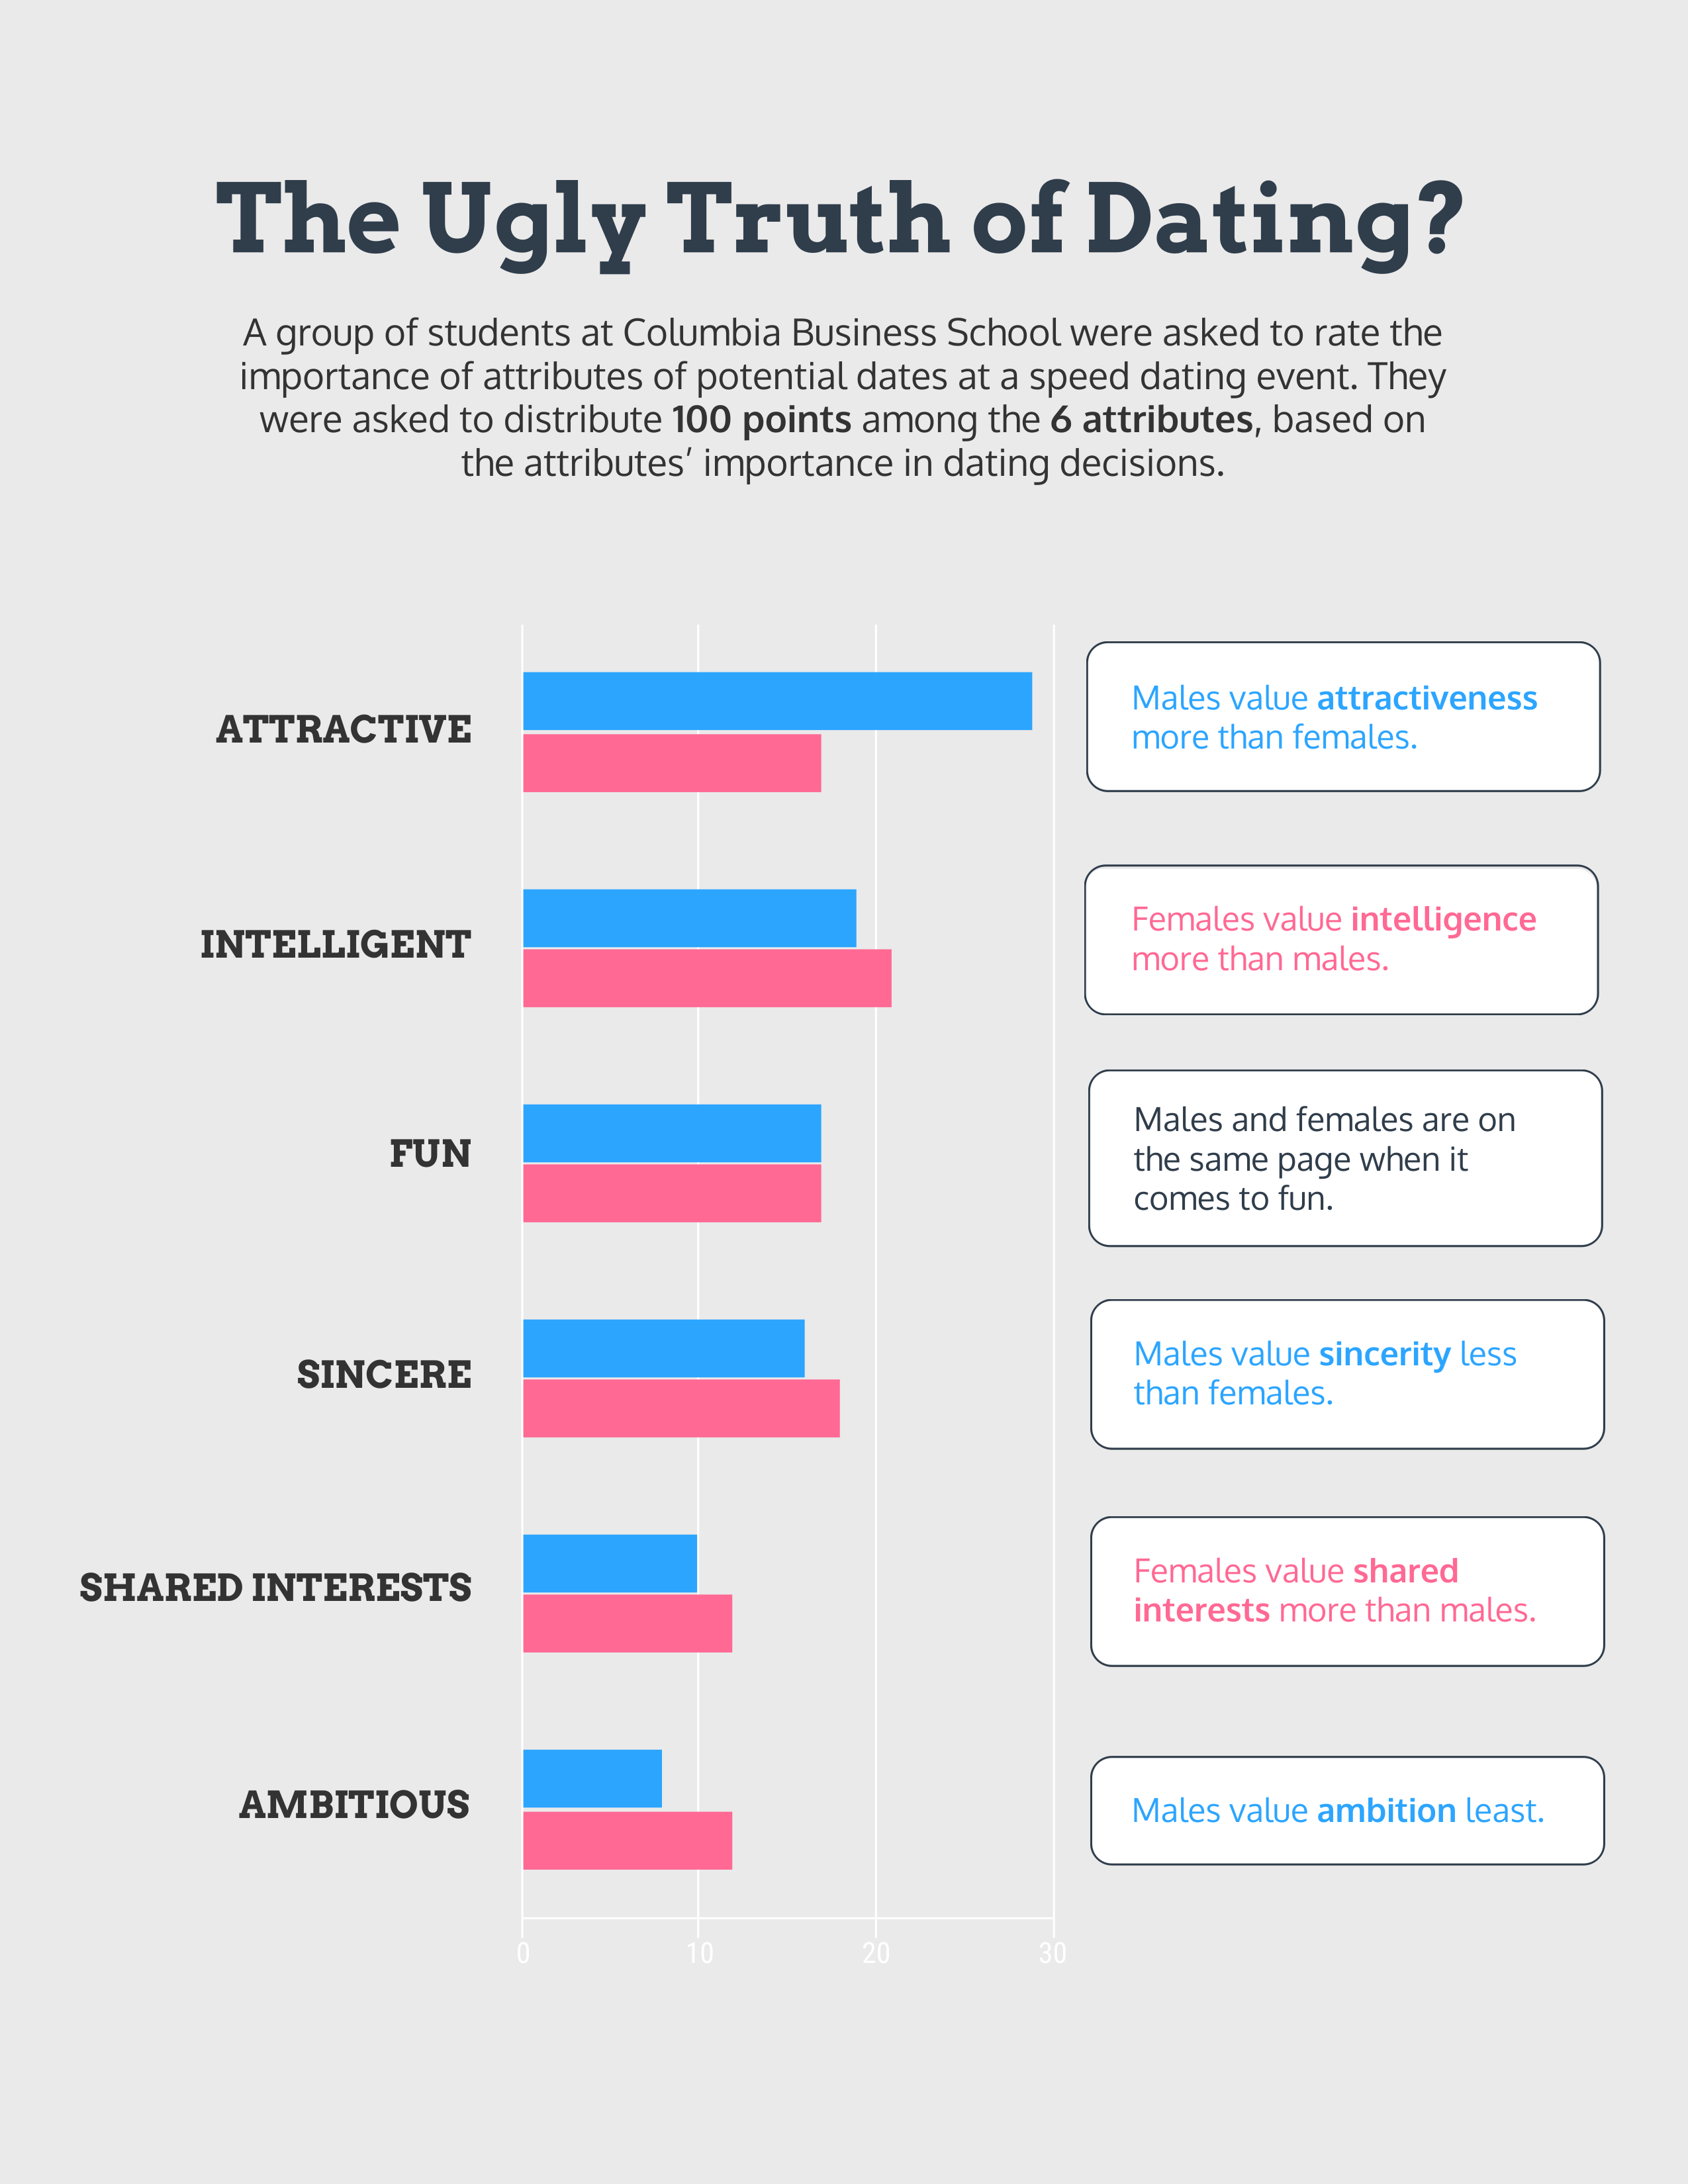
Some recent research may have just gotten us one step closer to hacking our way to love. A group of researchers at Columbia Business School studied male and female students to find out which attributes (out of attractiveness, intelligence, fun, sincerity, shared interests, and ambition) they valued most when looking for opposite-sex romantic partners.
At speed dating events they asked students to rate the importance of each personality trait by distributing 100 points among the 6 attributes. The students were asked to rate their own preferences, and then to predict the preferences of the opposite sex.
I set out to make a dating stats infographic that would help me see a few things:
- What are the gender differences when it comes to attribute importance?
- How accurately do we predict the preferences of the opposite sex?
Here’s the final visualization:

Designing the infographic
I started by removing any ratings with null values and taking out some responses that used a different rating system, leaving me with just over 450 ratings.
At this point I could have just taken the averages for each attribute, popped them into a bar chart, and called it a day, but I wasn’t ready to sacrifice that much detail. I needed to find a way to visualize distributions.
The tricky part was that needed to be able to make four comparisons:
- Male preferences vs female preferences
- Male predictions of female preferences vs female predictions of male preferences
- Male predictions of female preferences vs female preferences
- Female predictions of male preferences vs male preferences
How could I pull this off without introducing too much visual clutter?
I started with a dot plot to see where the data points were clustered. Understandably, many of the ratings were multiples of 5 or 10, or numbers that add up nicely to 100 (like 0, 33.3, and 66.6). This left me with a lot peaks and valleys which made the plots pretty useless for making comparisons.
Aggregating adjacent values with the trusty histogram (with a bin width of 5) helped, but I was still concerned with visual clutter, and I couldn’t figure out how I would make all four comparisons without repeating a lot of charts.
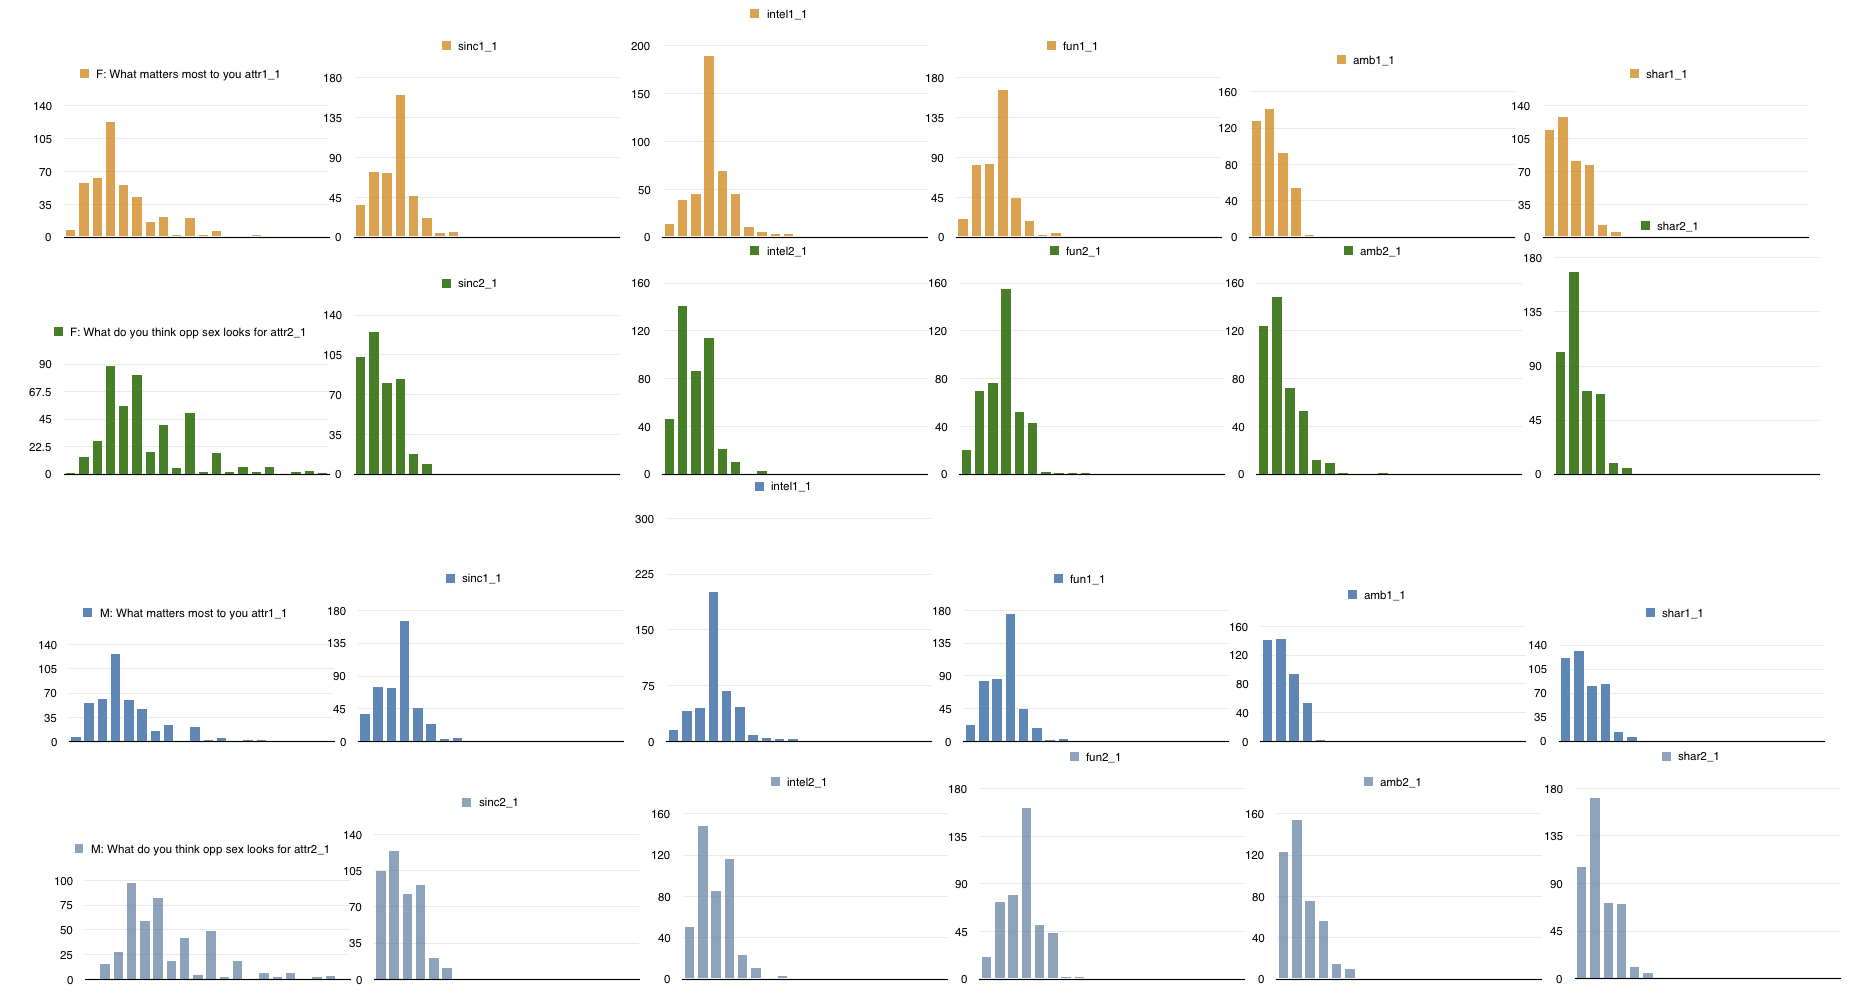
Enter: the density plot. Like a histogram, but with a smooth line that approximates the distribution. Less visual noise. Much easier to compare.

I created 4 plots for each personality trait (male preferences, female preferences, male predictions of female preferences, and female predictions of male preferences), leaving me with 24 plots in total.
I had figure out how to juxtapose these plots so that all four comparisons could be made for each personality trait. A violin plot seemed like the way to go – split such that males could be directly compared to females.
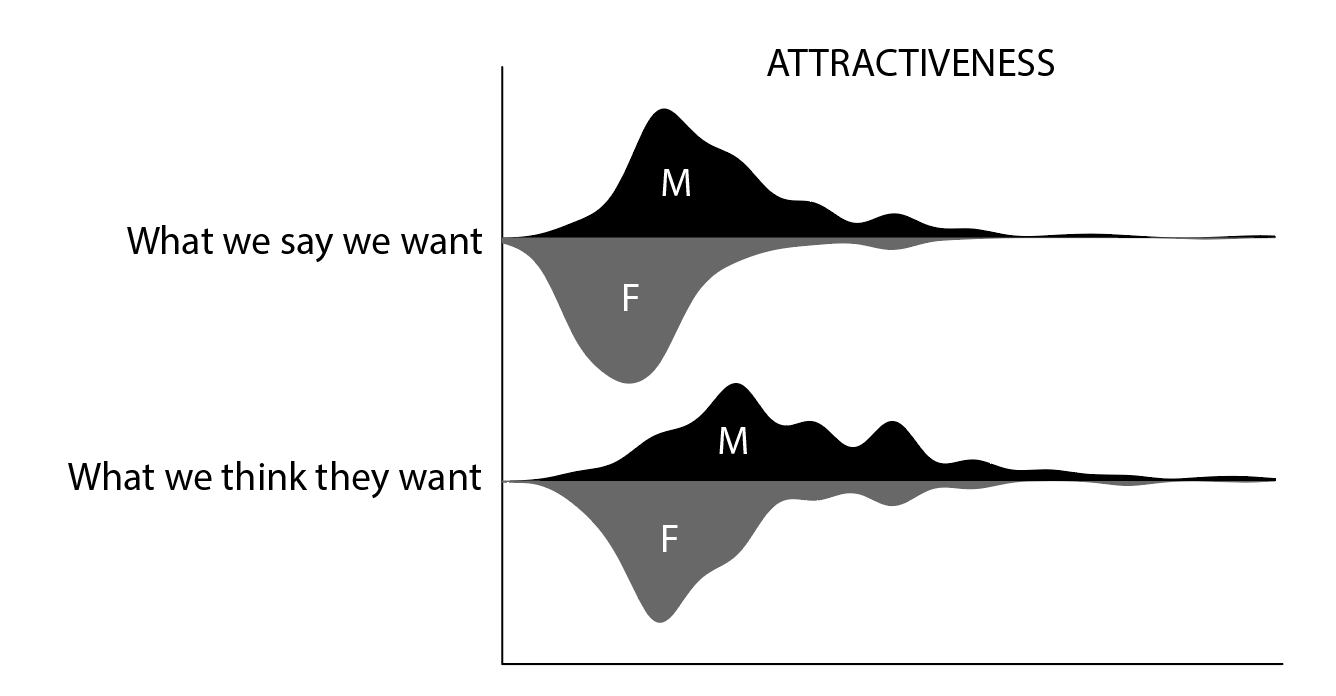
Color-coding was a natural next step. Lowering the opacity of the prediction ratings allowed me to overlay the predictions with the actual preferences for each gender, making it easier to immediately see discrepancies.

All that was left was to indicate the averages and add some annotations for each attribute.

As it turns out, the males in the study valued attractiveness much more than the females did, but not as much as the females thought they would.
Looking for another dating stats infographic to help you find love? Read about whether it’s possible to fall in love via text message.
Learn more about methods for visualizing distributions in Aran Lunzer and Amelia McNamara’s Exploring Histograms, or Nathan Yau’s How to Visualize and Compare Distributions in R.
Or get started with your own chart: