We use essential cookies to make Venngage work. By clicking “Accept All Cookies”, you agree to the storing of cookies on your device to enhance site navigation, analyze site usage, and assist in our marketing efforts.

Manage Cookies

Cookies and similar technologies collect certain information about how you’re using our website. Some of them are essential, and without them you wouldn’t be able to use Venngage. But others are optional, and you get to choose whether we use them or not.

Strictly Necessary Cookies

Always Active

These cookies are always on, as they’re essential for making Venngage work, and making it safe. Without these cookies, services you’ve asked for can’t be provided.

Show cookie providers

  • Venngage
  • Amazon
  • Google Login
  • Intercom

Functionality Cookies

These cookies help us provide enhanced functionality and personalisation, and remember your settings. They may be set by us or by third party providers.

Show cookie providers

  • Venngage
  • Chameleon
  • Intercom
  • Algolia

Performance Cookies

These cookies help us analyze how many people are using Venngage, where they come from and how they're using it. If you opt out of these cookies, we can’t get feedback to make Venngage better for you and all our users.

Show cookie providers

  • Venngage
  • Mixpanel
  • Intercom
  • Google Analytics
  • Hotjar

Targeting Cookies

These cookies are set by our advertising partners to track your activity and show you relevant Venngage ads on other sites as you browse the internet.

Show cookie providers

  • Google Ads
  • Google Tag Manager
  • Facebook
  • Pinterest
  • Product
  • Templates
  • Learn
  • Pricing
Learn
Educational Resources
Blog
Webinars
Help Center

Online Free Data Infographic Maker

Transform complex data into clear, visually striking infographics that instantly engage your audience and communicate your message effectively.

Online Free Data Infographic Maker

Not a designer? No problem. With our easy-to-edit data infographic templates and Data Infographic Maker, anyone can create an amazing infographic in minutes. Join over 40,000 businesses today in using Venngage's Data Infographic Maker.

Trusted by

Design data infographics that captivate and inform

Choose from thousands of data infographic templates See all data infographic templates

See all templates

Craft engaging data infographics that inspire

Craft engaging data infographics that inspire

Easily design the perfect infographic with our free Data Infographics Maker, featuring a wide range of professional and creative templates accessible to everyone.

Craft engaging data infographics that inspire

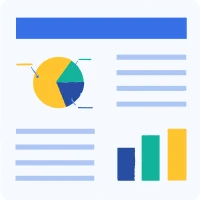
Transform survey data into clear, informative infographics or simplify complex reports into statistical visuals that are easy to understand.
Craft engaging data infographics that inspire

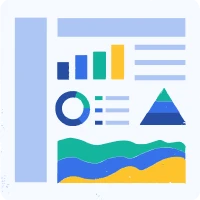
Elevate your data presentations by converting statistical reports into visually compelling infographics that capture attention and enhance comprehension.
Craft engaging data infographics that inspire

Regardless of your industry or topic, our free Data Infographic Maker empowers you to create engaging, customized infographics effortlessly.

How to Create an Impressive Data Infographic in 5 Steps
1
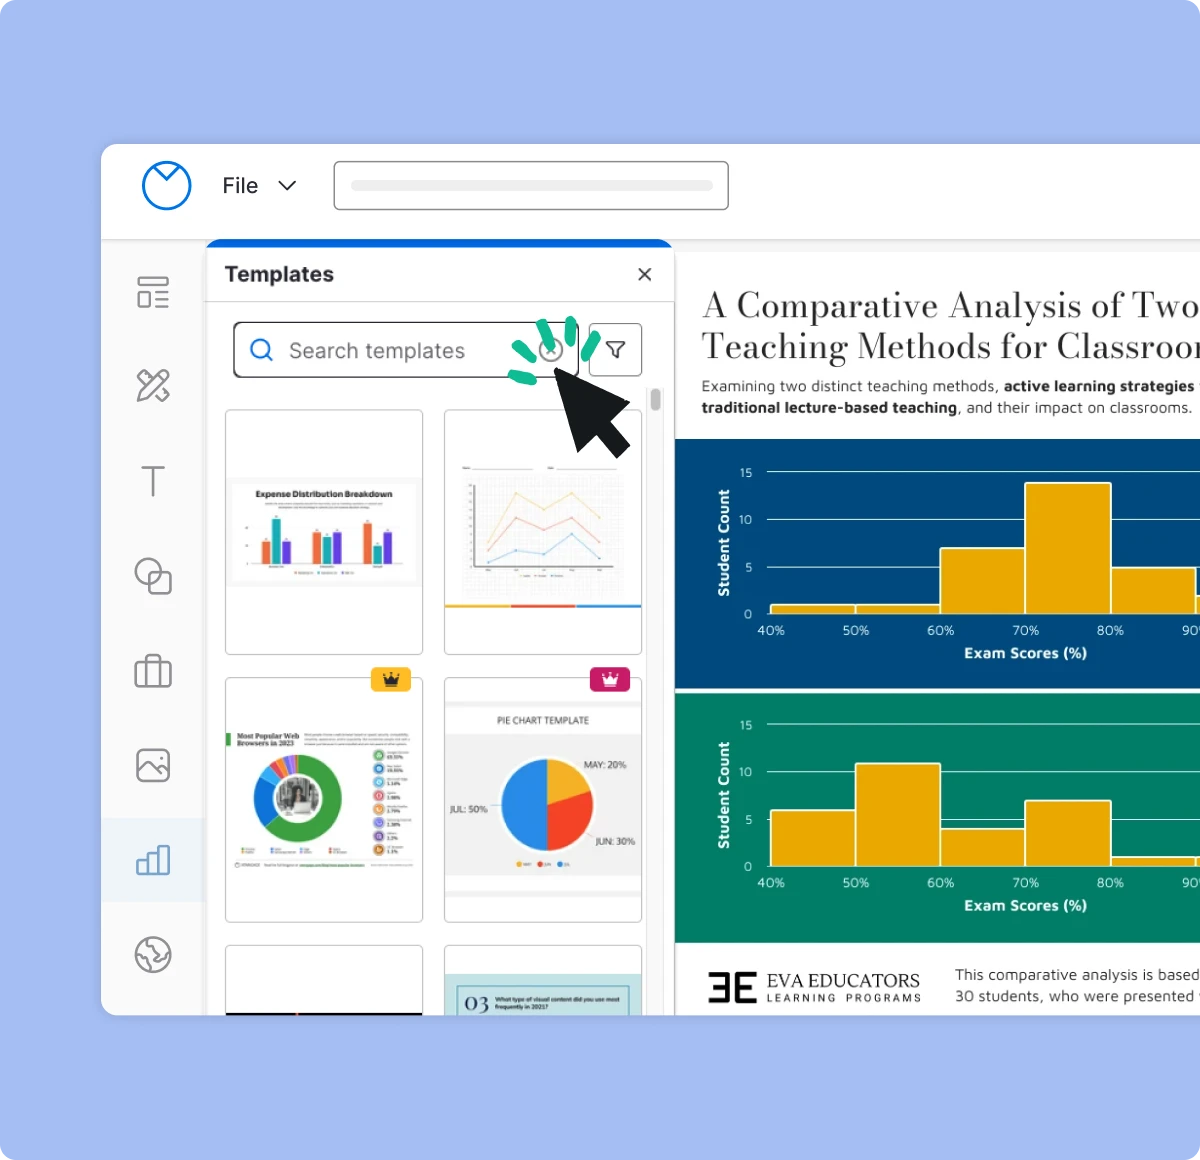
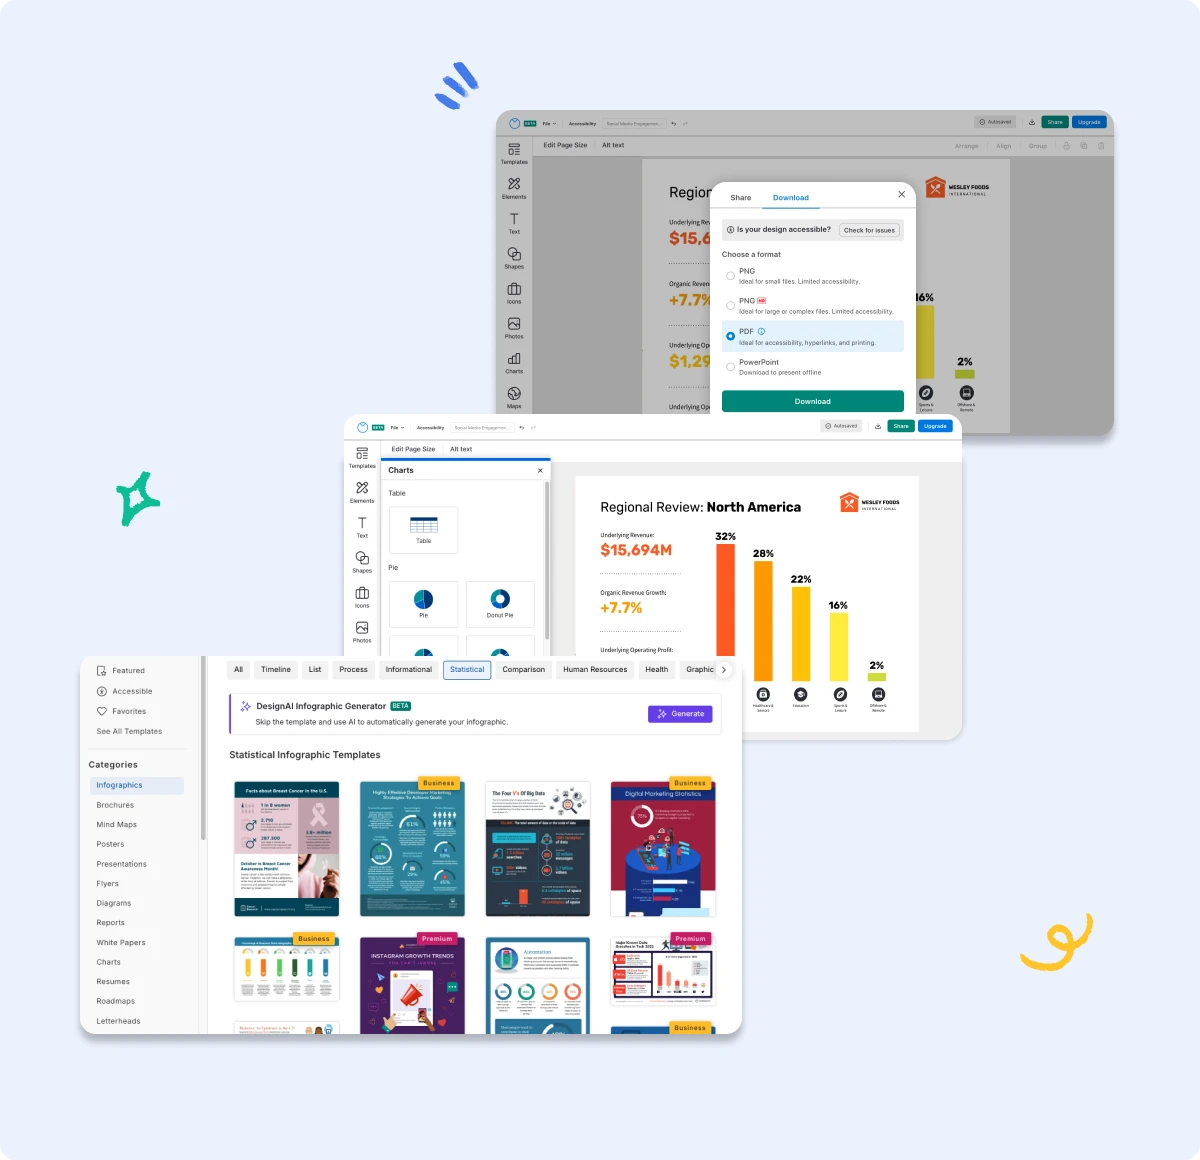
Explore Templates: Browse customizable infographic templates designed for data. Use search and categories to find your perfect match.
2
Create Your Account: Sign up for a free account using your email, Google, or Facebook profile.
3
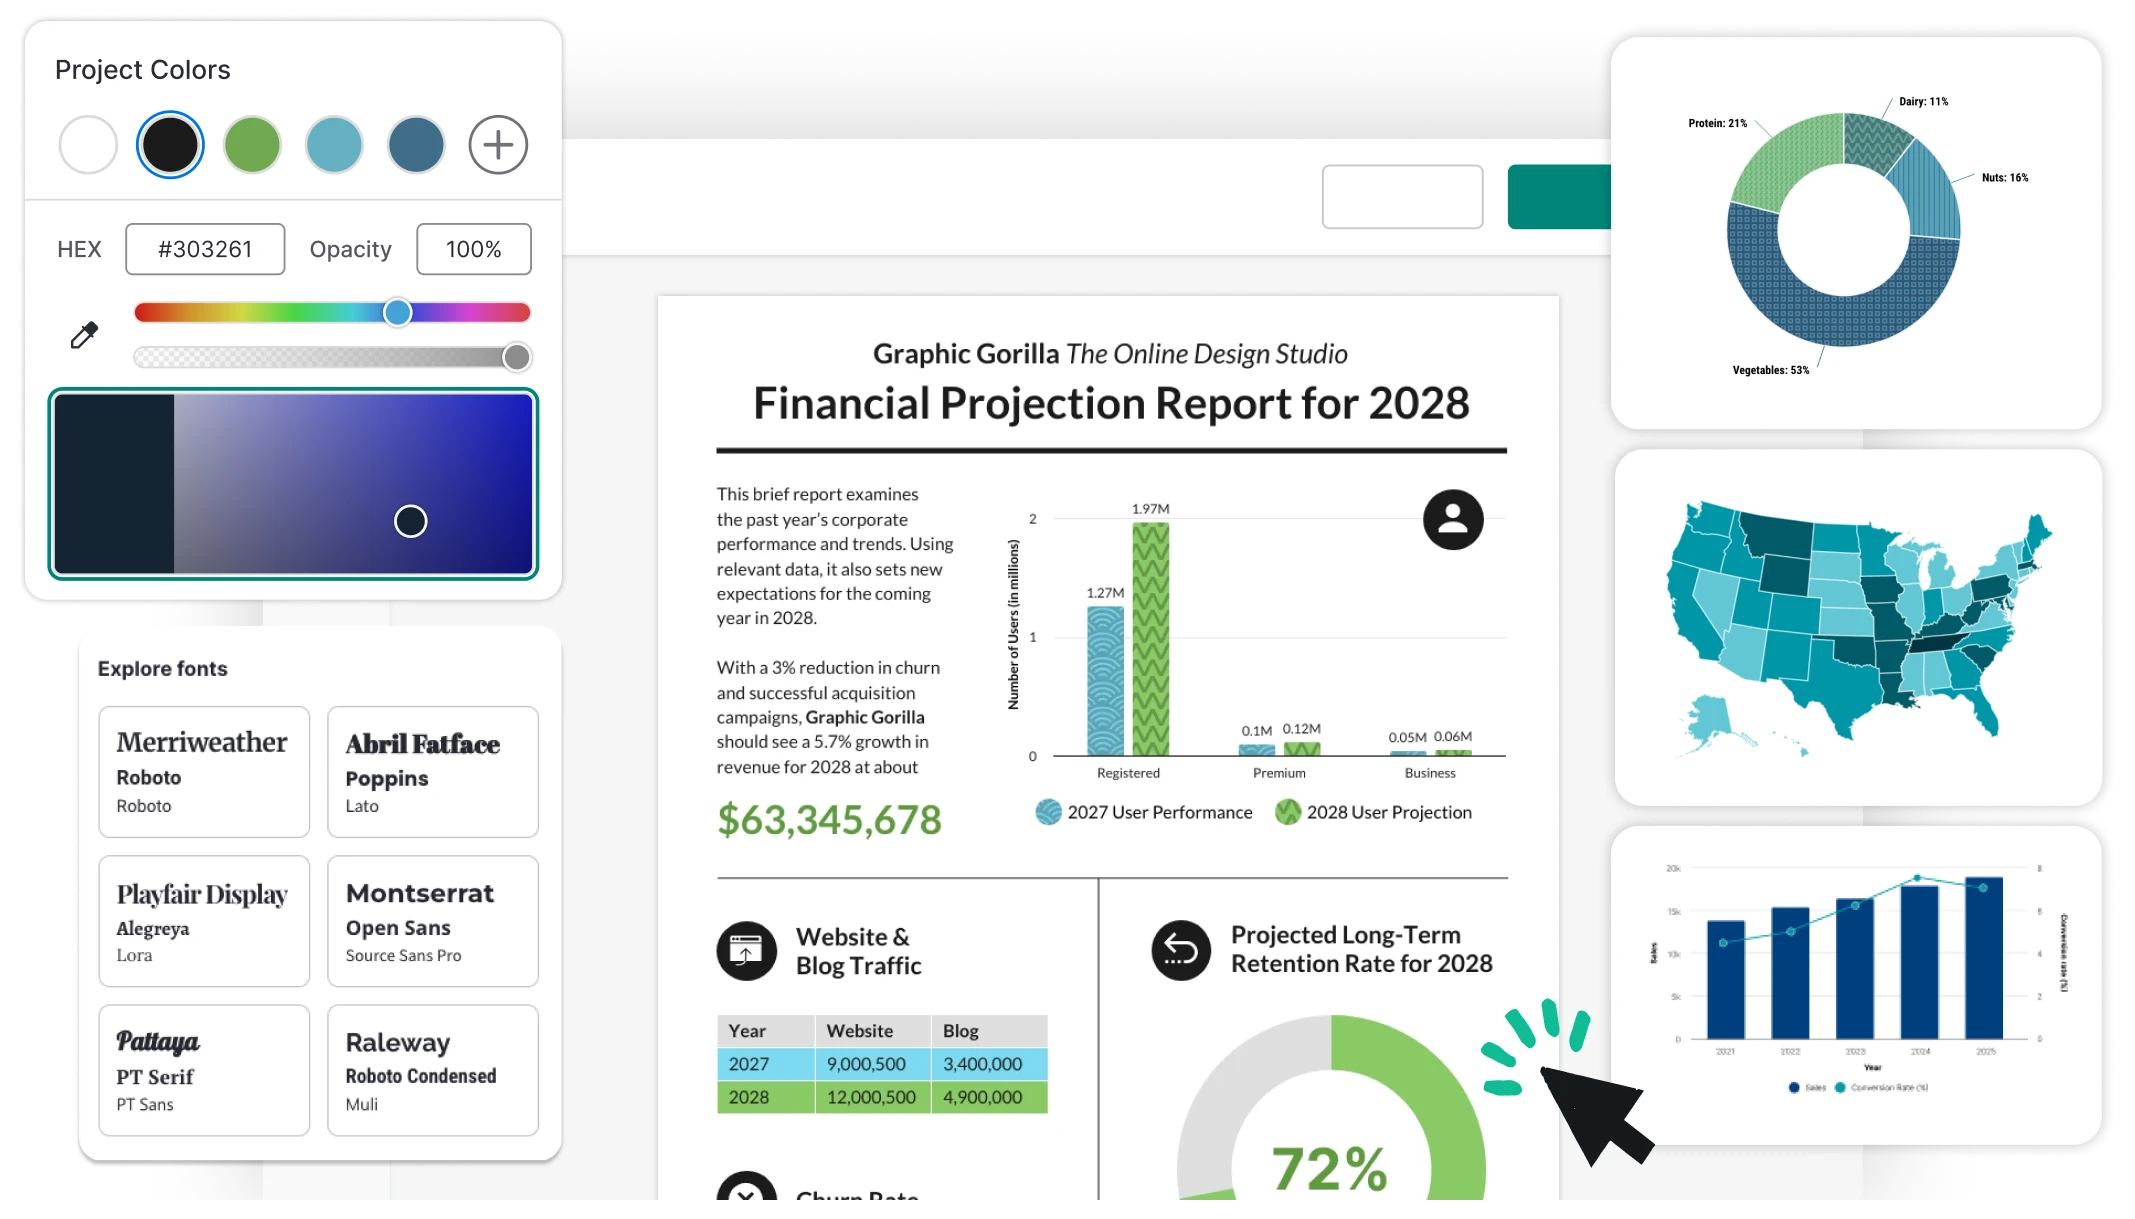
Customize Your Infographic: Use our drag-and-drop editor to input your data. Quickly adjust text, fonts, colors, and backgrounds.
4
Enhance with Icons: Upgrade your infographic with any of our 40,000+ free icons and illustrations.
5
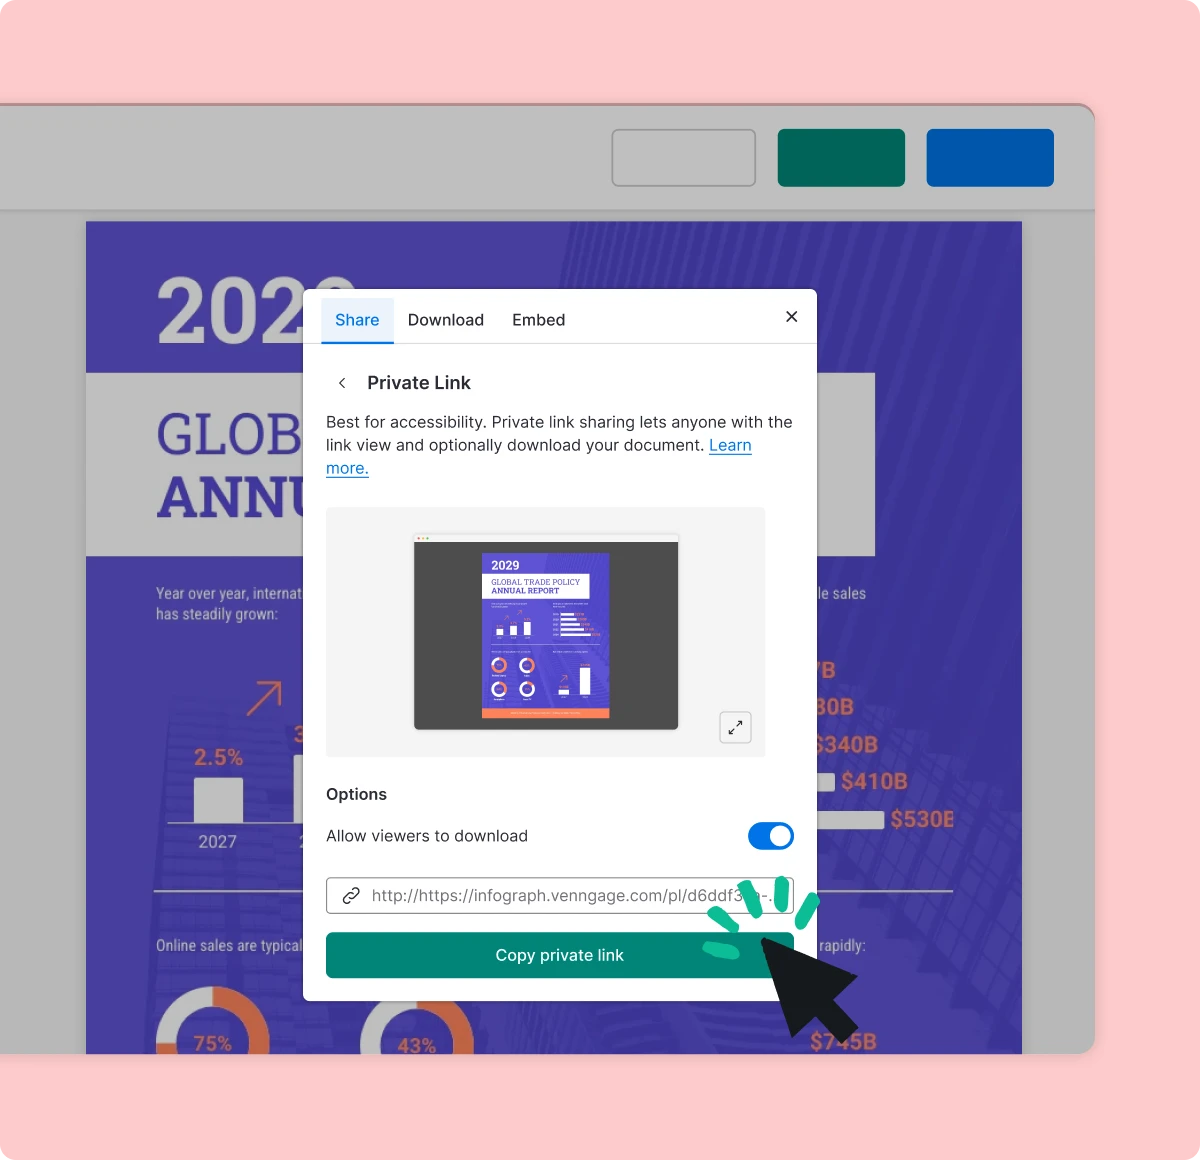
Share or Download: Download your infographic as a PNG or PDF, or share it via a private link.
How to Create an Impressive Data Infographic in 5 Steps

Design data with flair—let your numbers do the talking!

Customizable Data Infographics

Customizable Data Infographics

No design skills? No worries. Our data infographic templates are built for easy customization, allowing anyone to create visually stunning infographics with just a few clicks.

Intuitive Editor

Intuitive Editor

The Venngage editor offers a seamless drag-and-drop experience, making it effortless to create data infographics. You can easily replace text, images, icons, and integrate your data—all with a simple click.

Export to PNG, PDF or PowerPoint

Export to PNG, PDF or PowerPoint

Effortlessly share your infographics by downloading them as PNG or PDF files. Perfect for embedding in documents or incorporating into PowerPoint slides.

DesignAI

DesignAI

Easily integrate data infographics into your presentations. DesignAI streamlines the design process, automating your presentation creation and saving you valuable time.

24/7 Priority Support

24/7 Priority Support

Have a question? We're ready to assist. Our support team is available around the clock to ensure your data infographics keep your workflow running smoothly.

Royalty-Free Stock Photography

Royalty-Free Stock Photography

Enhance your data infographics with seamless integrations to free stock images. Instantly access high-quality, professional images with just a single click.

CREATE A DATA INFOGRAPHIC
What is a Data Infographic?

What is a Data Infographic?

A data infographic visualizes information, data, or knowledge intended to present complex information quickly and clearly.

By integrating text, images, charts, and graphs, data infographics effectively convey patterns, trends, and insights in a visually appealing and easily understandable format.

These infographics are often used in reports, presentations, marketing materials, and online content to simplify complex data and engage the audience.

They transform raw data into a compelling narrative, making it more accessible and memorable than traditional, text-heavy formats.

When to use Data Infographics?

Data infographics are ideal when you need to present statistics in a way that's both engaging and easy to understand.

Whether sharing key metrics in a business report, highlighting trends in a research paper, or making data-driven points in a presentation, data infographics distill complex information into clear, visual stories that resonate with your audience.

Data infographics are particularly effective when you want to emphasize key statistics or compare data points.

They're particularly effective for emphasizing key statistics or comparing data points, allowing you to transform raw numbers into visual narratives that make it easier for your audience to grasp the significance of the data and retain the information longer.
When to use Data Infographics?
Collaborate and Brand in Real-Time

Collaborate and Brand in Real-Time

Venngage's real-time collaboration feature lets your team work together seamlessly on data infographics, regardless of location. Multiple users can edit, comment, and brainstorm simultaneously, ensuring your infographics are polished and ready to share faster.

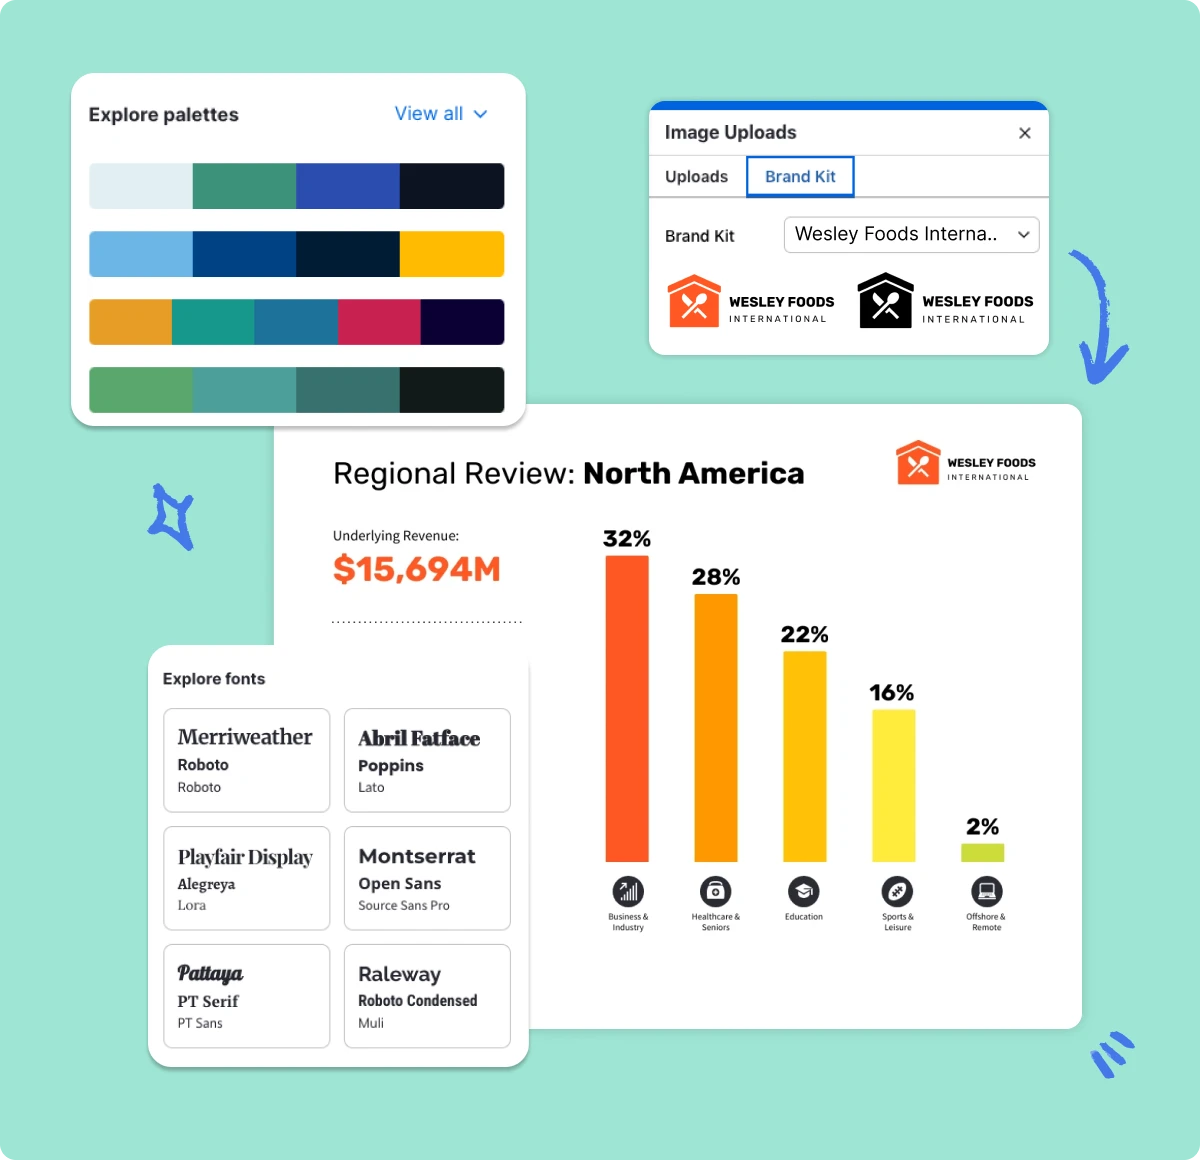
With Venngage's Brand Kit, you can effortlessly apply your company's unique branding to every infographic. Customize colors, fonts, and logos to align with your brand's identity, ensuring each infographic looks professional and stays true to your brand's voice.

What is Data Storytelling?

Data storytelling is a powerful method that combines narrative, data, and visuals to communicate insights and support decision-making. By turning complex data into engaging stories using tools like infographics, you can facilitate quicker and more informed decisions.

Effective data storytelling requires not only accurate data but also strong visualization skills. Although challenges like limited skills and data literacy can be intimidating, mastering data storytelling can lead to substantial benefits, including up to a 30% increase in sales and a 300% boost in engagement.

With Venngage's Data Infographic Maker, you can easily create compelling data stories, even if you have no prior design experience.
What is Data Storytelling?

FAQ

How do I download a Venngage Data infographic template?

You can download your data infographic template, from the Data Infographic Maker with a few clicks as a PNG, PDF or Interactive PDF.

What type of infographic templates does Venngage have?

We offer hundreds of expertly designed infographic templates, crafted by our professional designers to ensure easy and accessible use for everyone.

What else can I make with Venngage?

Venngage is your all-in-one solution for visual design. With a free Venngage account, you can create a wide range of visuals, including timelines, Gantt charts, roadmaps, reports, project management plans, white papers, data visualizations, brochures, line charts, history presentations, print materials, social media posts, and much more.

Make a data infographic that turns statistics into engaging and informative stories!

CREATE DATA INFOGRAPHICS

Get started with one of our top data infographic templates:

CREATE DATA INFOGRAPHICS