


A teacher walks into a classroom and suddenly, everyone gets quiet. They listen to the lecture very carefully, take notes, and ask few questions at the end. They take a short break after the class, only to prepare for another hour of such enjoyment.
If you had to think of a single word to describe that scene, what would it be?
Boring!
There’s no student in the world who would thrive in such a level of discipline.
Psychologists claim that the attention span of a typical university student is 10 – 15 minutes long. If you’re dealing with an online learning audience, you have an even bigger problem: people’s average attention span when reading online resources is 8 seconds.
That’s no joke. You have to invest a superhuman force to engage them.
Students Don’t Listen to Us. What Can We Do About That?
When students are given a task that seems challenging, they lose the motivation to try. Staying completely focused throughout a 50-minute lecture is definitely a challenge, so we can’t really blame them for not trying. A student’s attention can get away from you in seconds, so you have to find a way to hold it through innovative methods of teaching.
Simply taking on the role of an authority figure that they have to respect won’t work. We have a better suggestion for you: infographics.
With this form of content, you can present complex information enhanced with charts, symbols, lists, images, and other visual triggers. Instead of seeing the face of a bored student in front of you, you’ll start catching those “aha, I get it” expressions.
Infographics are already an established standard for presenting news and marketing campaigns. However, they also have huge potential for shining into the educational sphere, and you surely want to be among the first instructors who introduce the trend.
The only question is: how exactly do you use infographics in the educational process?
Here’s how to engage students using education infographics.
1. Interpreting Conversational Topics
When you introduce a topic for discussion, you have to give a brief presentation that will encourage your students to share their opinions. For example, let’s say you want to discuss the hashtag trend. Can your students remember when they first started using hashtags? Do they know where the trend comes from? Most of them don’t know there’s a whole history behind the hashtag.
You’ll look like the coolest teacher in the world if you can present a pop-culture topic through an infographic.
Take a look at this infographic:
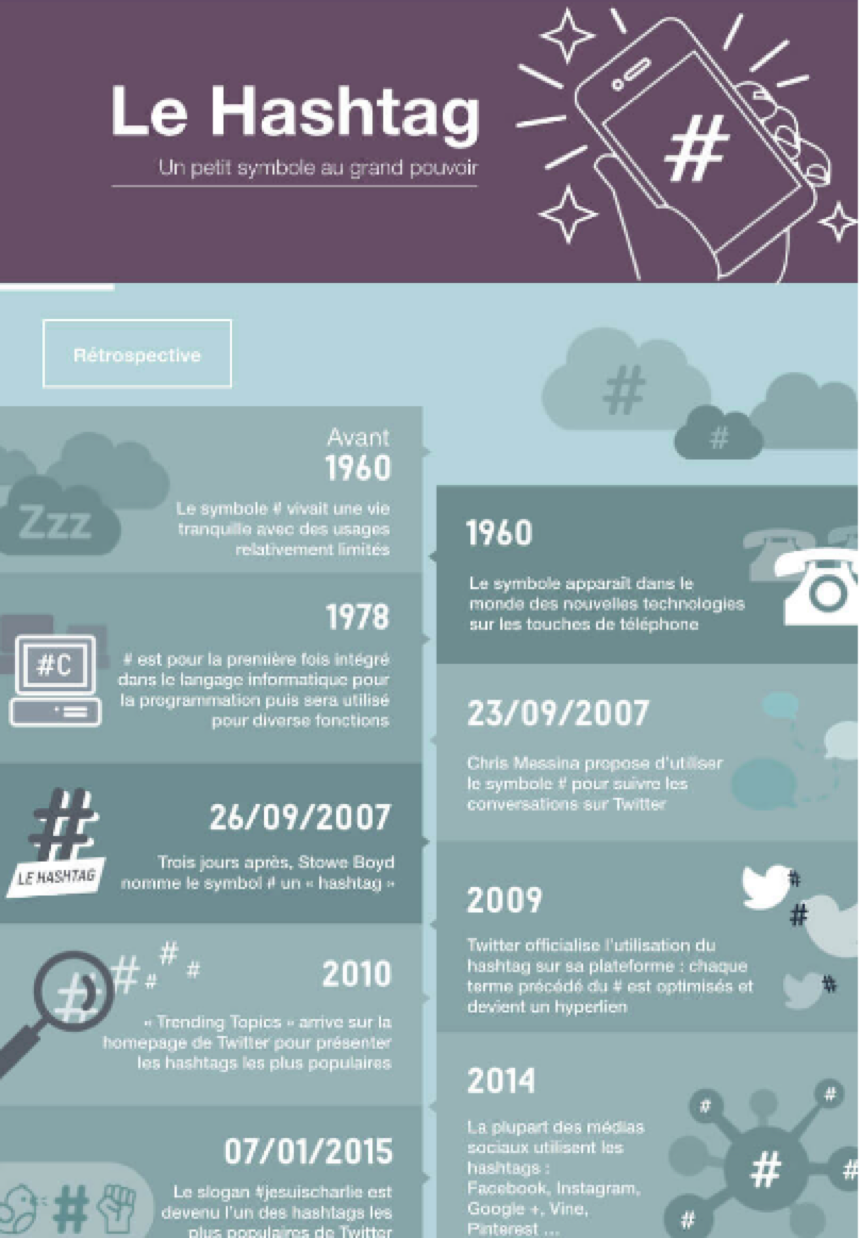
Okay, okay, it’s in French, but you’ll get the point. First, the infographic presents some history.
Then it shows how people use it, and then you get some statistics that show how effective it is for gaining popularity on social media.
Finally, the infographic shows how people shouldn’t use the infographic, and it ends with some tips on proper usage. Do you already see yourself giving a lecture on proper hashtag use through education infographics?
The coolest thing about this form of content is that it captures your students’ attention and they get your point. When you pick a great topic and show a fun infographic, you’ll intrigue them. You’ll have a great entrance to discussion questions. That’s your teaching superpower, right there.
Now, let’s see…how many of you use the hashtag? Why do you use it? Is it just because it’s popular, or you want to raise awareness about different issues? Do you think the hashtag is a lame trend?
So, here’s your recipe to a successful discussion: trendy topic presented with an infographic + intriguing questions your students understand.
2. Visual Presentation of Data
Duh! That’s the main point of an infographic: visual presentation of complex information. When you’re trying to convince your students that information is beautiful, the infographic is the right presentation method to choose.
Let’s say you’re giving a lecture on gender equality. You’ll have tons of statistics to present there. What’s the difference between the percentage of unemployment of men and women in different countries? What’s the difference in their salaries? What about education?
Wow, that would be a long, boring lecture suffocated with numbers and percentages. But not if you show it through an infographic!
Take a look at this infographic that shows data on teens and social media. When you see statistics represented in an appealing way, they don’t look overwhelming. In fact, your students might even remember some of the data you present, so be prepared for that surprise.
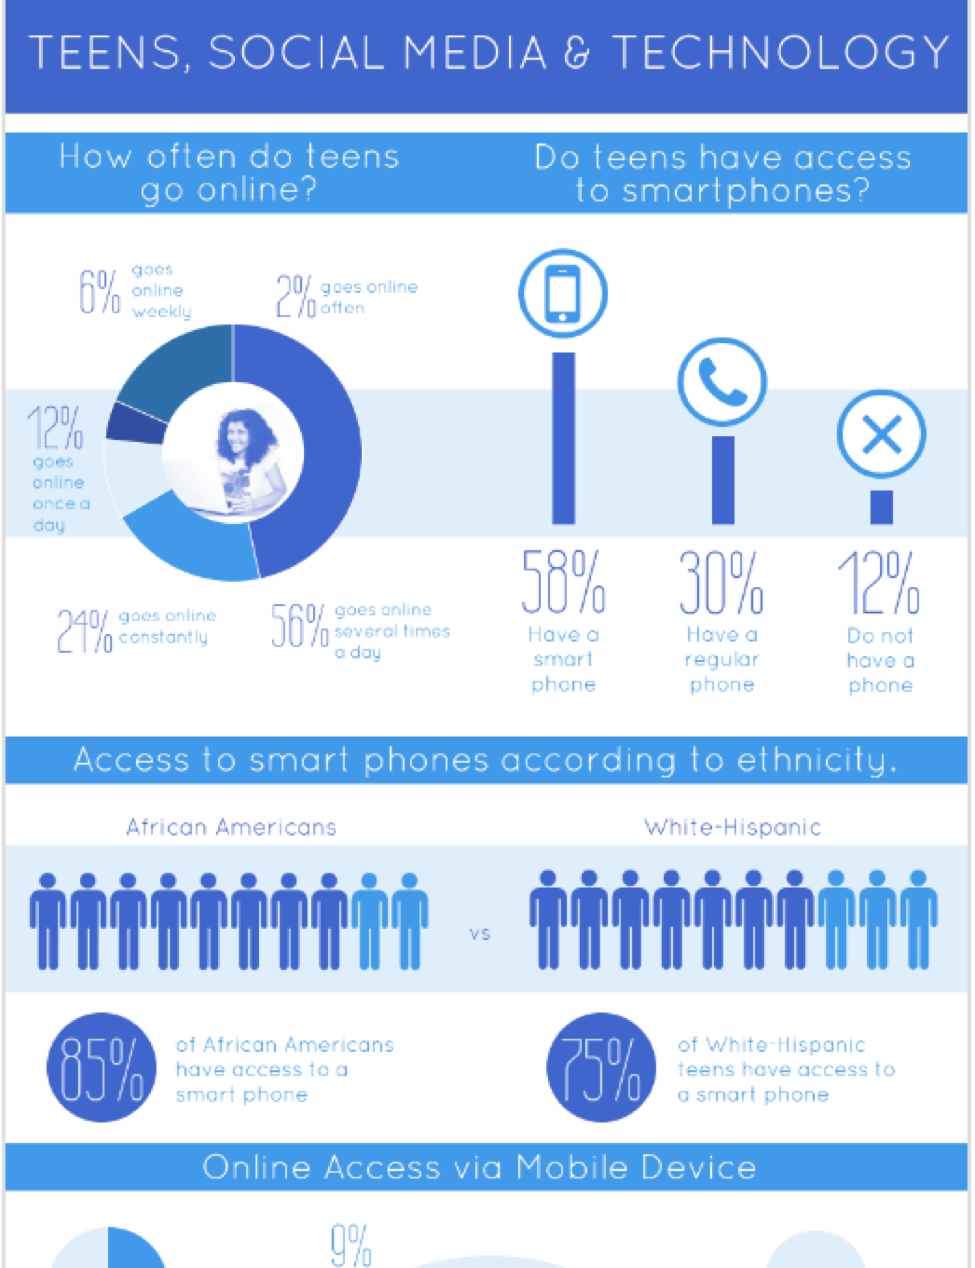
You can present your lecture the usual way, with the only difference that you’ll display an infographic instead of writing data on the whiteboard. The infographic will guide you through the numbers, but it will also catch your students’ attention.
3. Engaging Students in Arguments from Evidence
How do you teach your students to give arguments from evidence? As a teacher, you have a responsibility to encourage them to discuss different issues, identify their strengths and weaknesses, find the best explanation, and support their opinions with strong evidence. This process of reasoning is a crucial component of science and engineering classes.
Scientists must examine their own reasoning through research, and then defend their arguments with a solid base of data. Engineers rely on reasoning and argument to find the best solutions to the issues they come across. One of the critical stages of the engineering process is choosing the most promising solution among competing ideas from collaborators.
Even if you’re not currently preparing your students for careers in science or engineering, you’re aware of the fact that you need to help them develop the skills for presenting strong arguments from a very early age. This is a crucial skill for scientists and engineers, but people in all other professions will benefit from it. So how can you engage them in arguments from evidence? Wait for it…. education infographics!
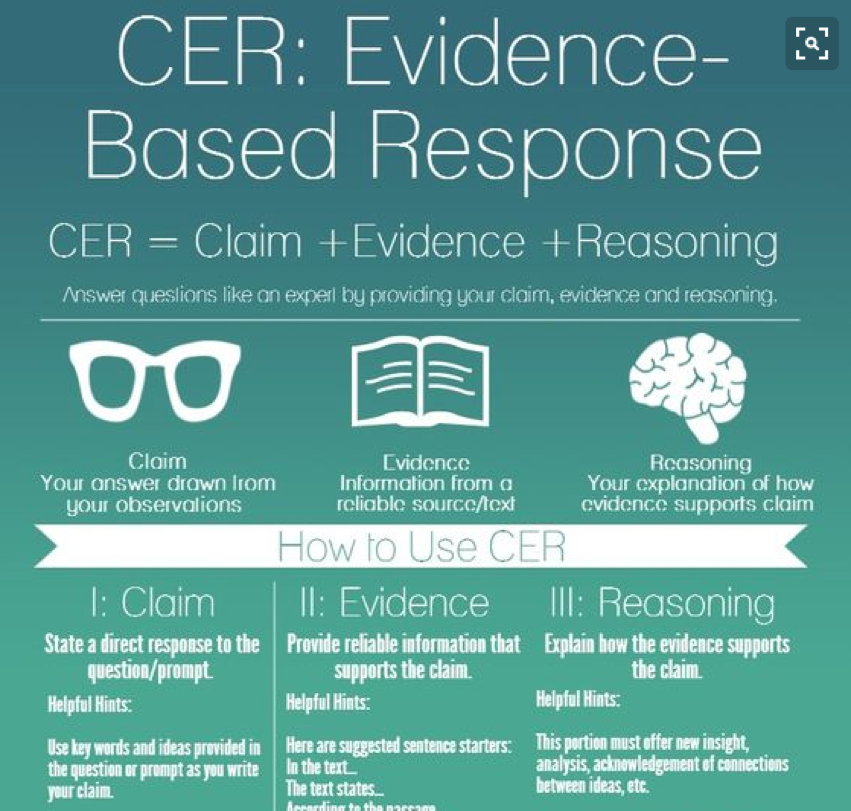
You can start with an infographic that explains the process of reasoning and providing evidence-based responses.
Once you introduce your students to a concept, you can show how the concept works in practice. Create an infographic that shows your own argument from evidence. For example, you can start talking about GMO and present scientific arguments that support your point of view. Here’s an example of such an infographic:
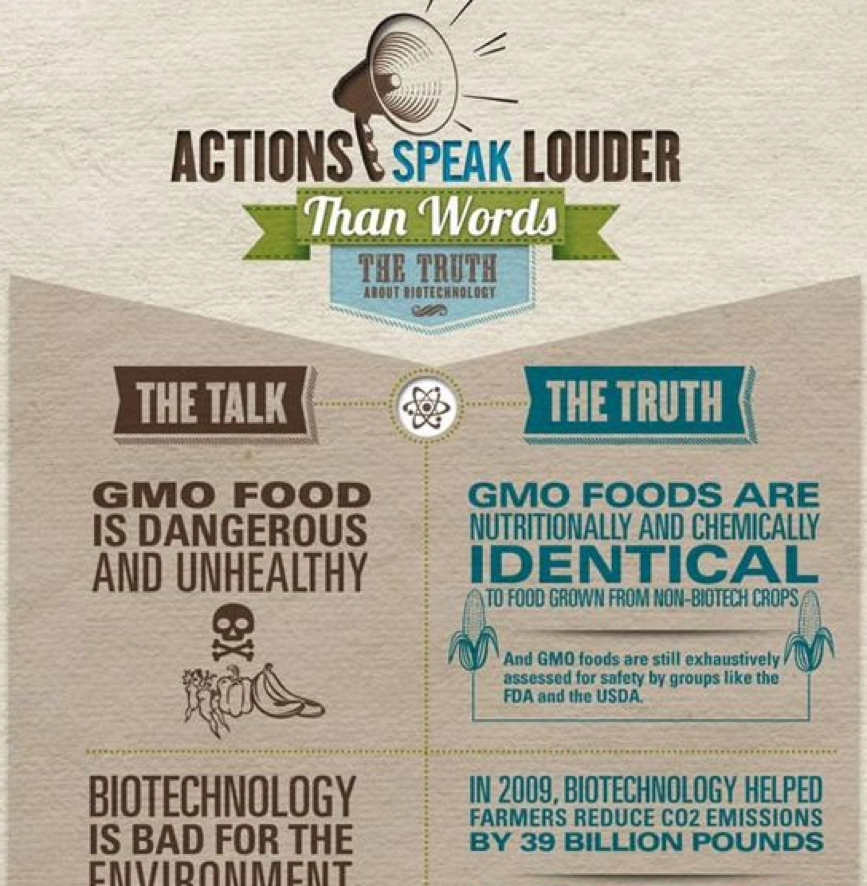
Your students will get the idea. Then, you can challenge them.
If you’re teaching students that already have solid computer skills, you can ask them to create their own infographics of arguments from evidence. This can be done as a team project. Give them enough time to do the research, form their argument, and design the infographic.
4. Infographics as Gamification Education Tools
Gamification is a huge trend in contemporary education. Students love playing games, so teachers are finding ways to use that passion against them. They trick them into learning through games.
Sounds smart, right? Through gamification of the learning process, you will teach your students to develop persistence, attention to detail, risk-taking, and problem-solving skills.
Now, how do infographics fit in?
You can present all elements of the game through an infographic. Your design should show the levels, point system, achievements, tasks, and rules. Instead of explaining how the game works, you’ll turn the narrative into an infographic that will give life to your instructions.
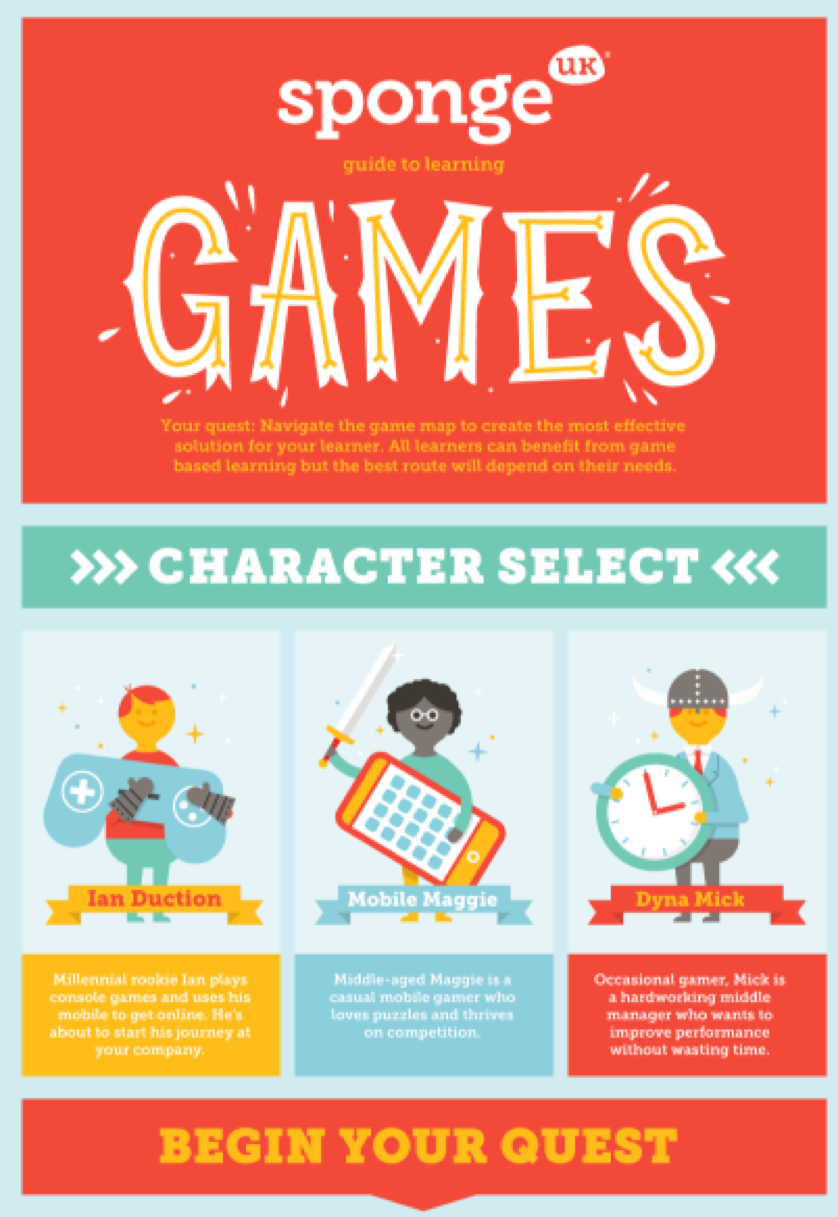
Check out this example of an infographic that shows such instructions. Conveniently enough, it shows you how to introduce games into the classroom.
If you have no idea what games to introduce into the classroom, you may find this list helpful.
5. Constructing Explanations and Designing Solutions
The practice of constructing explanations and designing solutions is similar to argumentation from evidence, but it takes the process a step forward: designing solutions. It requires students to evaluate a solution to a complex problem from the real world.
If the assignment is for engineering class, they should consider all constraints in the form of costs, reliability, safety, and visual appeal, as well as cultural, environmental, and social impacts. These same skills are valuable in contexts like MBA admissions consulting, where candidates need to present structured, evidence-based arguments clearly
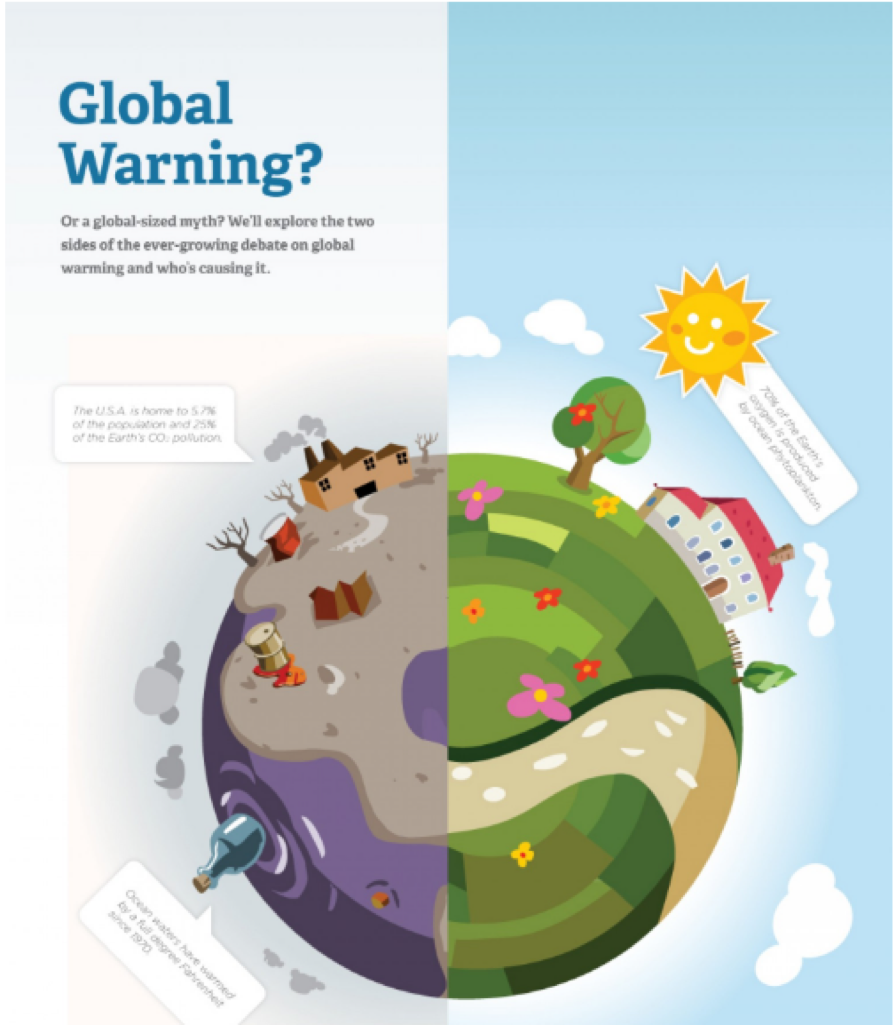
For example, you can ask your students to construct an explanation of the way human activity influences the occurrence of climate changes and natural hazards. Once they present the data they collect, they should come up with their suggestions for a solution.
When all this information is presented in an infographic, the project will be much more appealing, and the presentation will be cooler. You can collect all infographics and publish them on the class blog, so everyone will see what the other teams did.
Check out this great infographic based on constructing explanations and presenting solutions.
Want to Engage and Inspire Your Students? Try Infographics!
What’s the whole point of teaching, anyway?
You need to find a fun way to present the lectures, ask the right questions, and guide your students into a discussion that won’t overwhelm them. The traditional schooling method no longer works; you have to keep pace with modern technology if you want to make learning attractive for your students.
Infographics fit right into the picture of modern education. You can use them to present intriguing concepts and provocative statements and inspire your students to craft their own design.
And an infographic looks fun, but it takes effort. The student will have to do some research and collect evidence while presenting their own opinions along the way.
That’s what we call a successful assignment.


