
Business Supply and Demand Diagram Template
Design a supply and demand diagram by using the Venngage supply and demand diagram template.

 100% customizable templates
 Millions of photos, icons, charts and graphics
 AI-powered editing features
 Effortlessly share, download, embed and publish
 Easily generate QR codes for your designs
- SizeLetter (8.5 x 11 in)
- File typePNG, PDF, PowerPoint
- Planbusiness
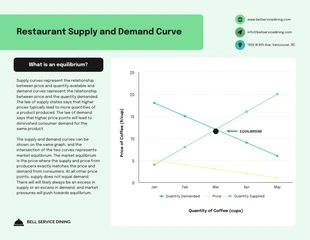
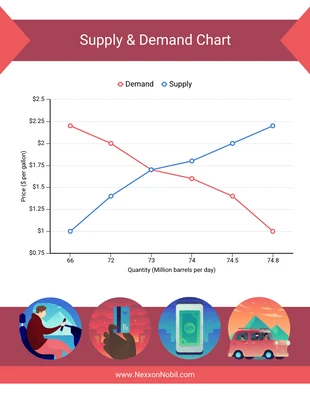
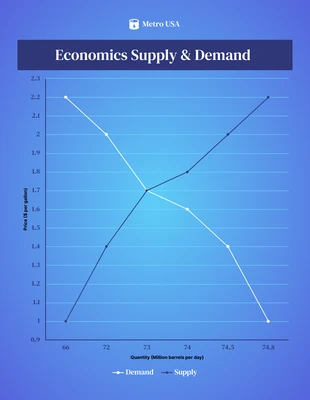
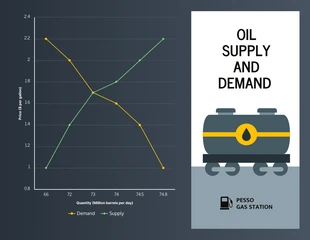
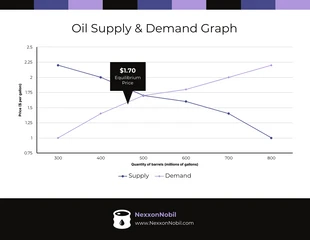
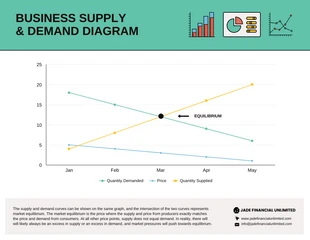
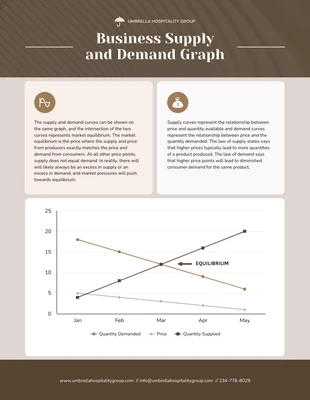
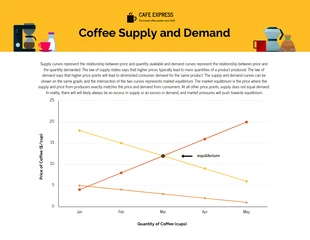
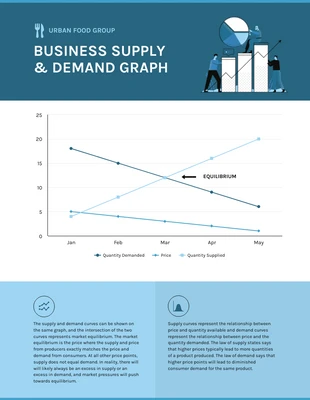
A supply and demand diagram template is a helpful way to visualize the interaction between supply and demand in a market. It can help identify when shortages or surpluses might occur, and how they might be resolved. The diagram consists of two curves: one for supply and one for demand. The intersection of these curves shows the market equilibrium, where the quantity demanded and supplied is equal. Changes in any of the factors affecting supply or demand will shift the curves and can lead to changes in the market equilibrium. The supply curve shows the quantity of a good that producers are willing to sell at each price. The demand curve shows the quantity of a good that consumers are willing to buy at each price. When the two curves intersect, the quantity demanded and supplied is equal, and there is no shortage or surplus. If the demand curve shifts to the right, demand will increase and the market equilibrium will move to the right. If the supply curve shifts to the left, supply will decrease and the market equilibrium will
Related Chart Templates
line charts
line charts
line charts
line charts
line charts
line charts
line charts
line charts
line charts