
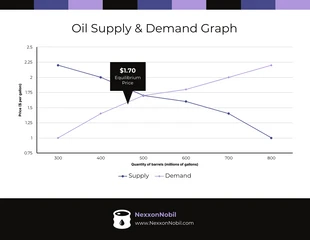
Resturant Supply and Demand Curve Graph Template
Create a supply and demand curve graph by editing this supply and demand curve graph template from Venngage.

 100% customizable templates
 Millions of photos, icons, charts and graphics
 AI-powered editing features
 Effortlessly share, download, embed and publish
 Easily generate QR codes for your designs
- SizeLetter (11 x 8.5 in)
- File typePNG, PDF, PowerPoint
- Planpremium
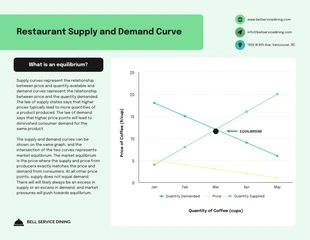
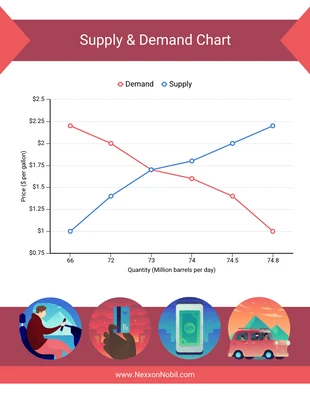
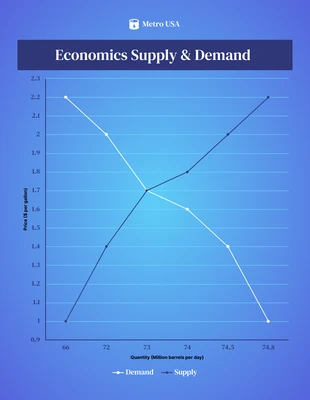
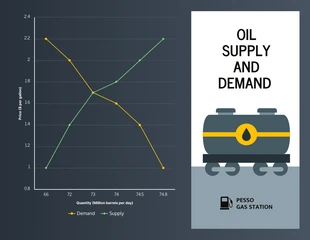
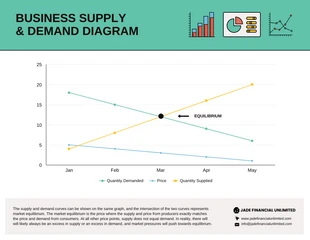
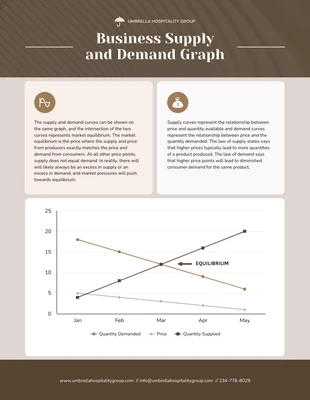
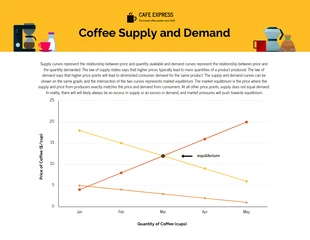
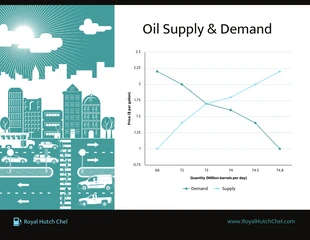
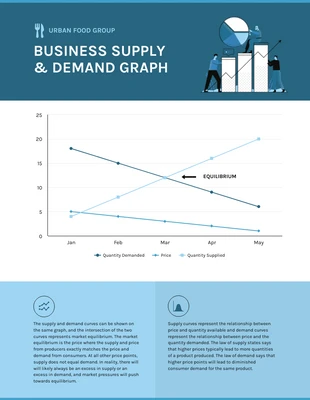
The supply and demand curve graph template is used to show the relationship between the quantity supplied and the quantity demanded at a specific price. The template is made up of a supply curve and a demand curve, which are intersected by a line representing the equilibrium price. The supply curve shows the amount that suppliers are willing to sell at each price, while the demand curve shows the amount that consumers are willing to buy at each price. The equilibrium price is the price where the quantity supplied equals the quantity demanded. The supply and demand curve graph template can be used to show how changes in supply or demand can affect the equilibrium price and quantity. For example, if there is a decrease in supply, the supply curve will shift to the left, and the equilibrium price will increase. If there is an increase in demand, the demand curve will shift to the right, and the equilibrium quantity will increase. Editting this template doesn't require any design experience or special design tools. Venngage's supply and demand curve graph template is
Related Chart Templates
line charts
line charts
line charts
line charts
line charts
line charts
line charts
line charts
line charts