
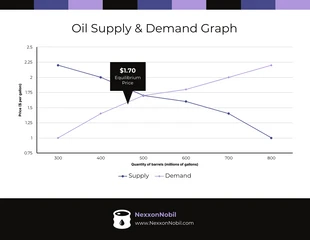
Economics Supply and Demand Line Graph Template
Create an economics supply and demand graph by editing the economics supply and demand graph template here on Venngage.

 100% customizable templates
 Millions of photos, icons, charts and graphics
 AI-powered editing features
 Effortlessly share, download, embed and publish
 Easily generate QR codes for your designs
- Design stylemodern
- Colorsvibrant
- SizeLetter (8.5 x 11 in)
- File typePNG, PDF, PowerPoint
- Planfree
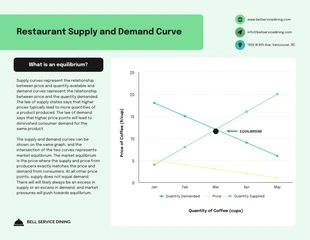
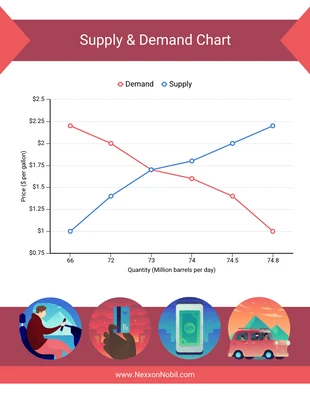
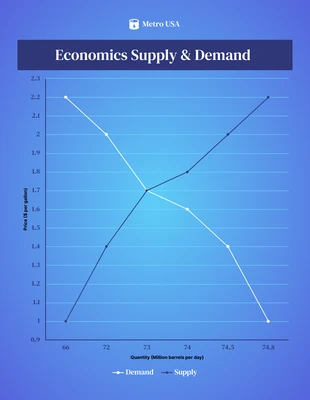
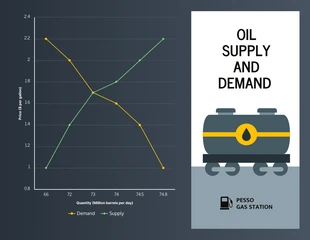
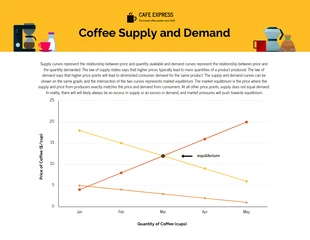
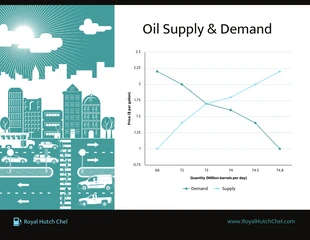
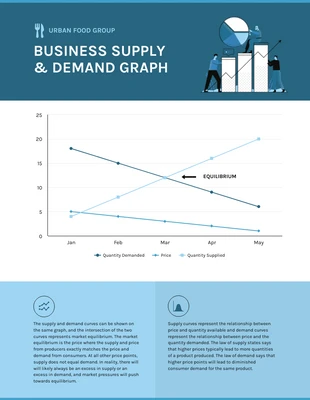
An economics supply and demand graph template is helpful for visualizing the relationship between the supply of a good or service and the demand for it. The graph can help policymakers and analysts understand when prices are likely to rise or fall, and how changes in supply or demand might affect prices. This template can be used to help visualize these changes. For example, if the demand for a product increases, then the demand curve will shift to the right, and the equilibrium quantity and price will increase. If the supply of a product decreases, then the supply curve will shift to the left, and the equilibrium quantity and price will decrease. Create an economics supply and demand graph template here on Venngage. It's simple to use, and it's a snap to modify. Users with little or no design background will be able to utilize this template with ease. To get started using this template, click the "Create" button. It's possible to modify everything you see in the editor, from font styles, icon designs, color palettes, and even the text itself. In the
Related Chart Templates
line charts
line charts
line charts
line charts
line charts
line charts
line charts
line charts
line charts