
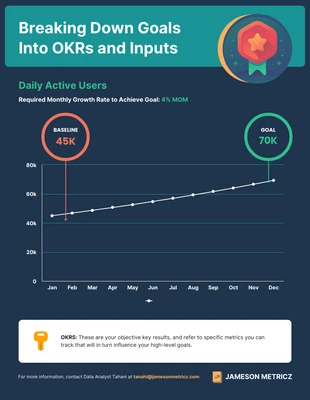
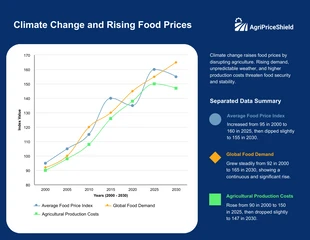
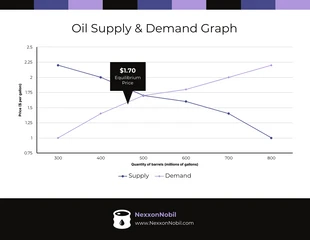
Oil Supply and Demand Price Line Graph Template
Make a price graph by modifying equilibrium price graph template.

 100% customizable templates
 Millions of photos, icons, charts and graphics
 AI-powered editing features
 Effortlessly share, download, embed and publish
 Easily generate QR codes for your designs
- Design stylemodern
- Colorslight
- SizeLetter (11 x 8.5 in)
- File typePNG, PDF, PowerPoint
- Planfree
An equilibrium price graph template is a graph that shows the equilibrium price for a given market. It can also show how changes in supply or demand can affect the equilibrium price. The equilibrium price is the price at which the quantity demanded is equal to the quantity supplied. This template can be used to help businesses understand how changes in the market can affect prices. It can also help businesses decide whether to increase or decrease production in order to meet changing demand. This design is ideal for those who have little or no design expertise, but require a versatile, creative solution to make them appear their best. This Venngage template is ideal for any scenario and the uses are limitless! To begin, press the create button to generate this equilibrium price graph template. You may completely change the appearance of your template in the editor. From font types, icon styles, color palettes, and even the text itself, you may modify everything you see. It's all about uncomplicated things. Keep things consistent by using one style of icons across
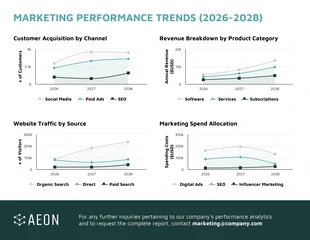
Related Chart Templates
line charts
stacked charts
line charts
stacked charts
stacked charts
stacked charts
line charts
stacked charts