Free AI Curve Graph Generator
Show trends with smooth, simple curves. No spreadsheets needed.
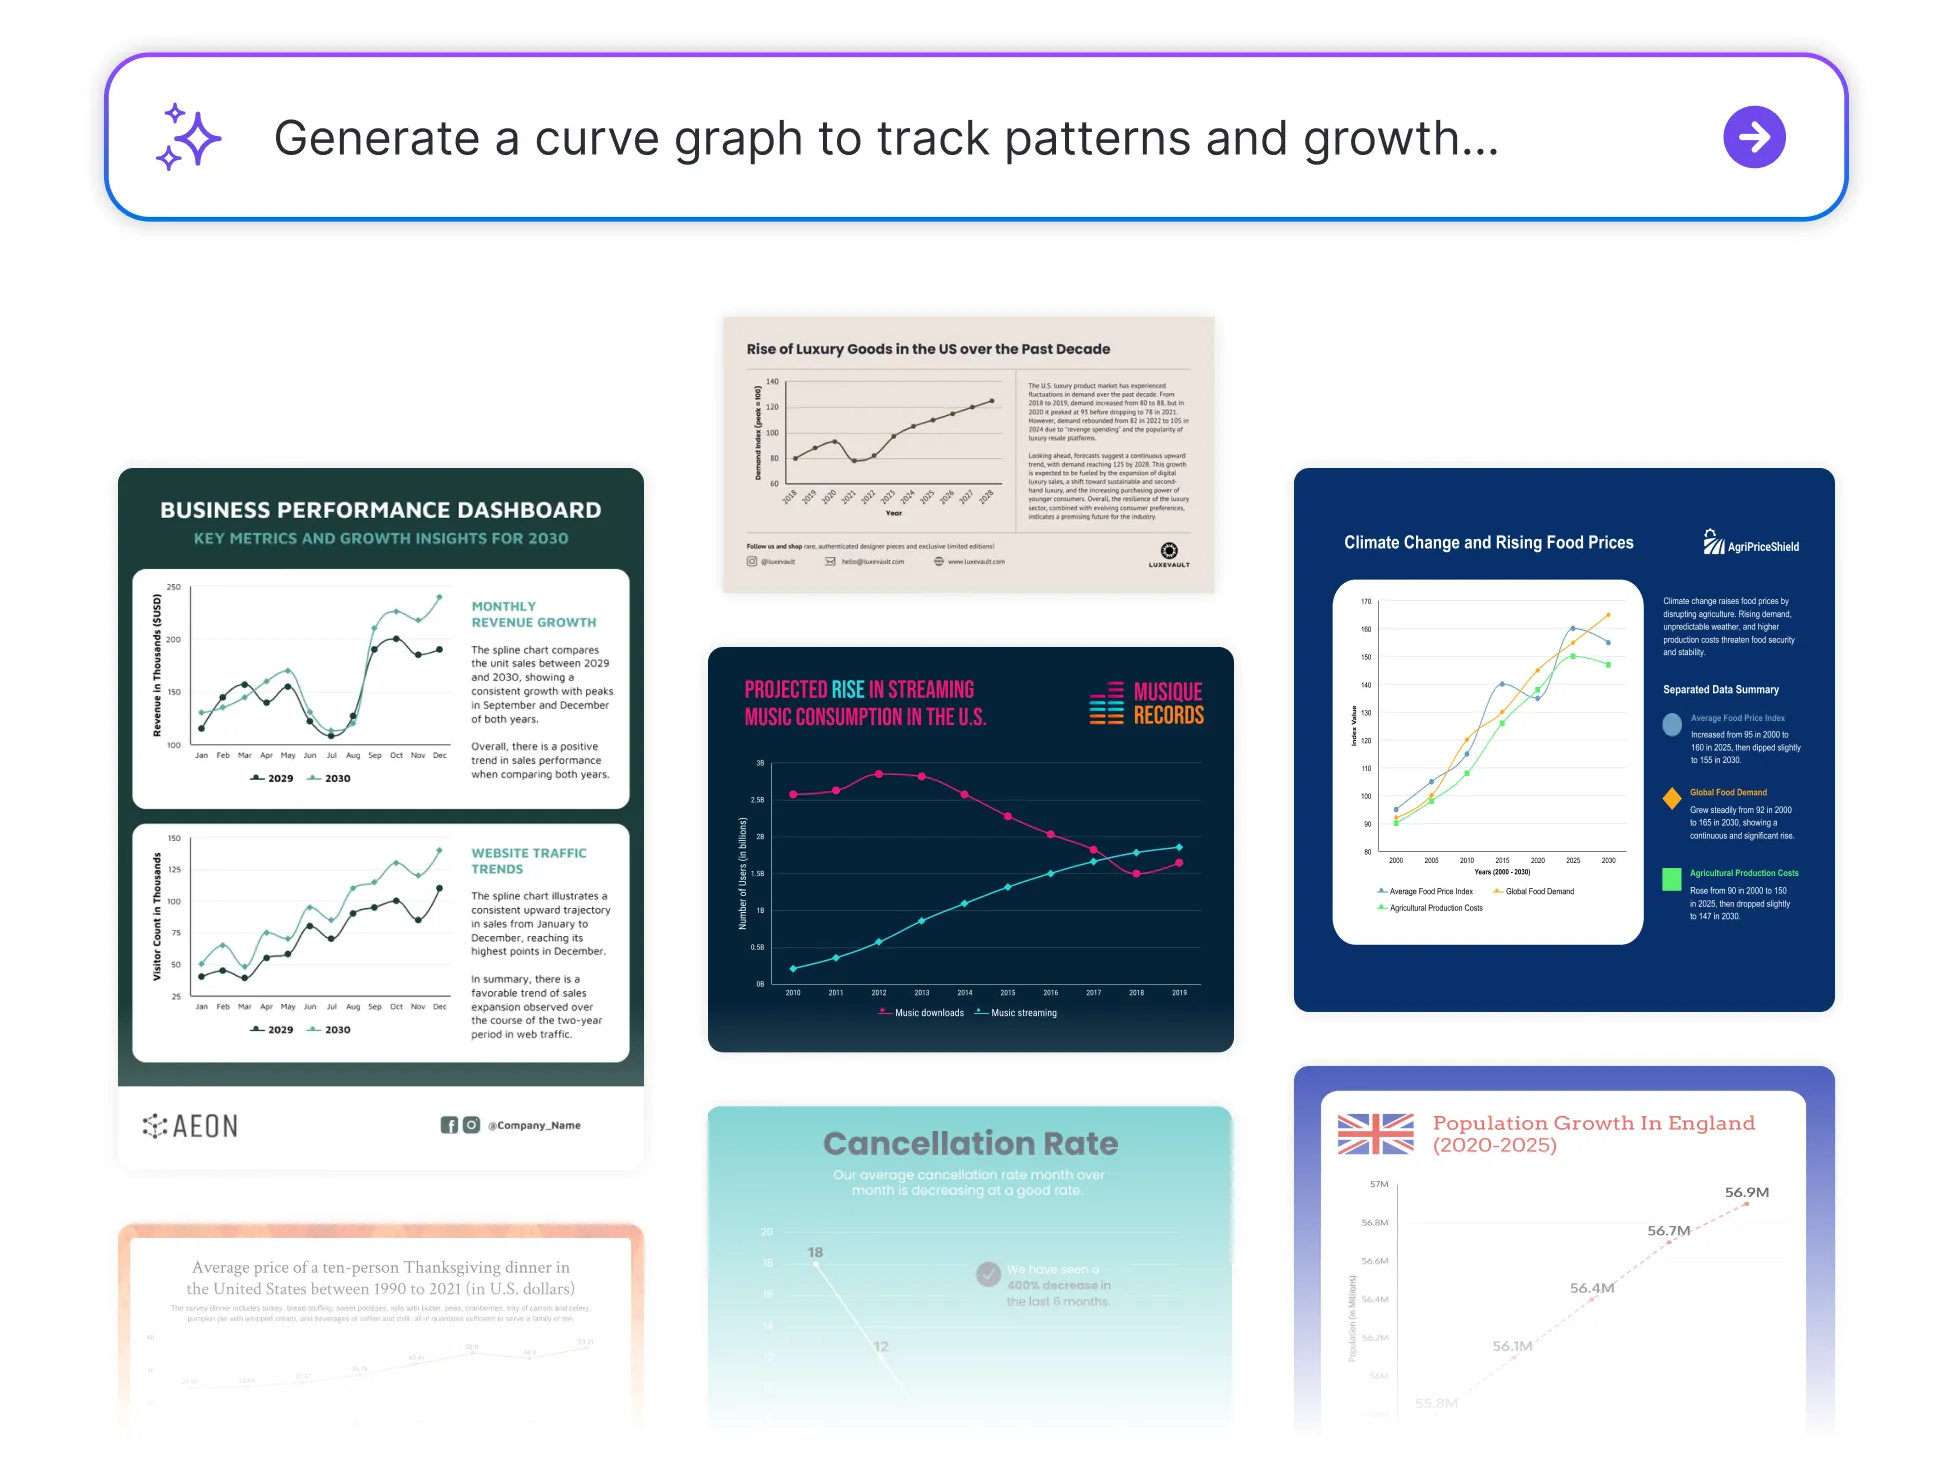
Browse Through More Curve Graph Templates
Popular AI Design Generators
How to Create a Curve Graph in Under 5 Minutes
Step 1: Enter Your Data
Start by adding your values, whether you're tracking growth, patterns, or changes over time.
Step 2: Let AI Generate the Curve
Venngage’s AI automatically transforms your data into a smooth, flowing curve graph, no complex setup needed.
Step 3: Edit Labels and Axes
Tweak your graph titles, data points, and axis labels to make everything easy to read and understand.
Step 4: Customize the Design
Use Venngage’s drag-and-drop editor to adjust colors, line styles, fonts, and more. Add your Brand Kit for a polished, professional look.
Step 5: Download or Share Instantly
Export your graph as a PDF, PNG, or link to attach into reports, decks, or dashboards.
Analysts Looking to Show Trends Smoothly
Want to highlight patterns or growth over time? Venngage’s Curve Graph Generator helps you turn raw data into smooth, flowing visuals.
It’s perfect for reports, forecasts, and dashboards that need to look sharp and stay clear. Skip the clunky charts. Just drop in your data and let the curve do the talking.
Generate a Curve Graph
UX Designers Mapping User Behavior
Need to show how users interact with your product over time? Venngage’s Curve Graph Generator helps you visualize engagement flows, drop-off points, and trends in a format that’s easy to share with dev teams or stakeholders.
Just plug in your metrics and create a smooth, user-friendly story from your data.
Generate a Curve Graph
Researchers Presenting Experimental Results
Need to show how something changes over time or under different conditions? Venngage’s Curve Graph Generator helps researchers transform experimental data into clean, curve-based visuals that clearly communicate patterns, trends, or correlations.
The AI Curve Graph generator is ideal for academic papers, grant proposals, or classroom presentations. Upload your numbers and build a graph that brings clarity to your findings.
Generate a Curve Graph
Generate Curve Graphs In Seconds With Our AI Curve Graph Generator

Plot Smooth, Clear Trends in Seconds
Just enter your data and Venngage’s AI instantly generates a polished curve graph, perfect for highlighting gradual change, growth, or flow.

Make Complex Patterns Easy to Understand
Curved lines help emphasize movement and progression, turning raw data into visuals that feel intuitive and easy to follow.

Customize Every Element
With Venngage’s drag-and-drop editor, you can adjust colors, line styles, fonts, and layout to match your presentation style or audience.

Stay Consistent with Your Brand
Using Venngage’s Brand Kit, you can automatically apply your logo, brand colors, and fonts, making your graph presentation-ready without extra formatting.

Designed for Any Skill Level
Whether you’re an analyst, student, or product lead, Venngage makes it simple to build beautiful, effective curve graphs.

Download or Share Instantly
Export your graph as a high-quality image, PDF, or link. Use it in reports, dashboards, slide decks, or share it directly with your team.
Fuel Your Creativity with AI-Powered Design Tools
Venngage is your one-stop shop for creating impactful presentations, infographics, reports, and more. It's a favorite among professionals, educators, and marketers for a reason:
AI Branding Automation
Instantly extract brand colors, fonts, and styles. Auto-apply your logo and visual identity to every design for seamless brand consistency.

DesignAI Generator
Turn simple prompts into stunning professional visuals in seconds. Describe what you need in plain language and watch our AI generate layouts optimized for maximum visual impact.

AI Content Auto-Fill
Kickstart your design process in seconds. Choose a template and let our AI auto-fill it with relevant, on-brand content, ideal for streamlining workflow and boosting productivity.

AI Generated Icons and Images
Create unique visuals that perfectly match your content and style. Generate custom illustrations, icons and images that align perfectly with your brand.

AI Writer and Translation
Enhance clarity, rewrite content, and instantly translate text to create accessible, global-ready visuals.

Smart Accessibility AI
Ensure every project looks great and works for everyone. Use AI to write alt text check contrast, layout, and font readability, and export fully WCAG-compliant visuals and PDFs.

FAQs
Absolutely. All AI-generated curve graphs on Venngage's platform are fully customizable, allowing you to personalize colors, designs, images and more to match your unique vision.
Yes, there are a variety of design generators available on Venngage. Along with the AI Curve Graph Generator, Venngage offers tools to create infographics, social media posts, reports, and more. These AI design tools are easy to use and customizable, helping you generate professional visuals quickly to match your style and needs.
Yes, the AI-generated curve graphs created using Venngage's tools are copyright-free. You can use them for both personal and commercial purposes without any restrictions on copyright. However, it's always good practice to ensure that any externally sourced content you include is also cleared for use.
We offer a free plan so you can try out all our AI features without spending anything. If you want more advanced features like private sharing and auto branding, we've got Premium and Business plans available too.