
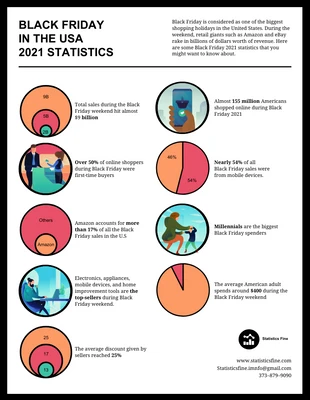
Black Friday Statistics In USA Infographic Template
Edit and customize this template to create your marketing material about the most interesting Black Friday Statistics By Year

 100% customizable templates
 Millions of photos, icons, charts and graphics
 AI-powered editing features
 Effortlessly share, download, embed and publish
 Easily generate QR codes for your designs
- Design stylevintage
- Colorsdark
- SizeLetter (8.5 x 11 in)
- File typePNG, PDF, PowerPoint
- Planpremium
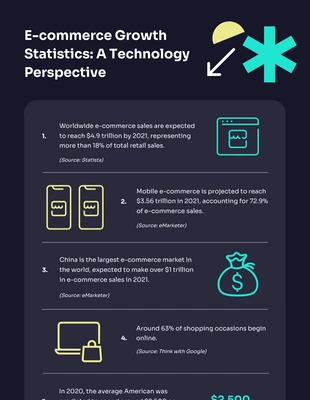
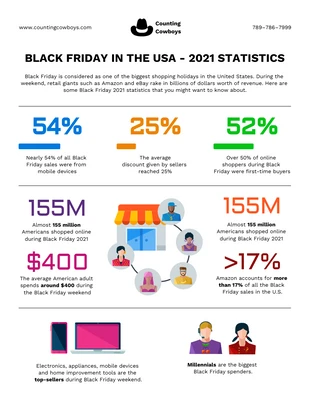
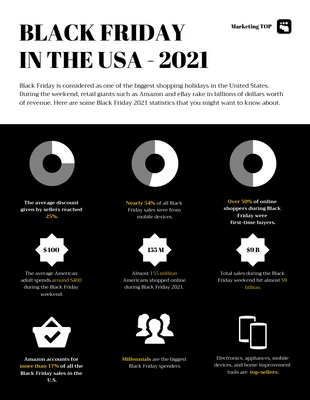
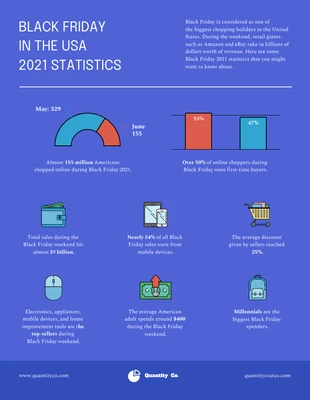
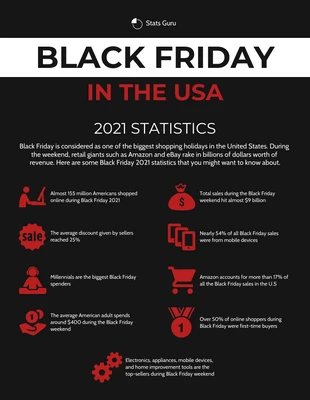
There is no doubt that Black Friday is one of the most important shopping holidays for business owners. Because this day marks the end of Thanksgiving and the beginning of the Christmas shopping season, many people splurge during the Black Friday weekend. Merchants and sellers give out anywhere between 50% to 70% off during their Black Friday deals. In the U.S., many people await the Black Friday weekend before they start buying year-end gifts for friends and families. According to many retailers’ Black Friday statistics by year, some of the most popular items during this shopping weekend are appliances, home improvement tools, apparel, computer peripherals, electronic devices, mobile phones, and televisions. If you are a business owner, doing good during the Black Friday weekend can set your business up for massive success. Because of the billions of dollars spent during the Black Friday weekend, many businesses strive to compete and outdo each other for customer attention. According to Black Friday statistics by year, the biggest winners during these days are Amazon, eBay, and Walmart. If you are a business owner, creating your
Related Infographic Templates
technology infographics
statistical infographics
statistical infographics
technology infographics
statistical infographics
statistical infographics
statistical infographics
safety infographics
statistical infographics
statistical infographics
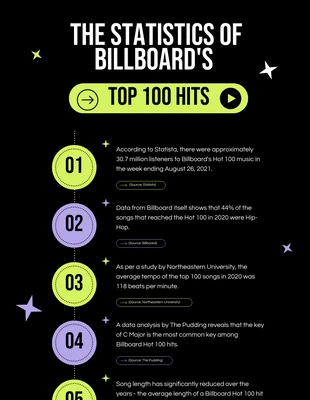
music infographics
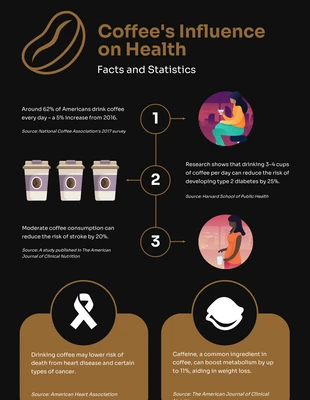
coffee infographics