
What is Big Data Infographic Template
Use this editable Big Data Infographic Template to display fun facts and statistics!

 100% customizable templates
 Millions of photos, icons, charts and graphics
 AI-powered editing features
 Effortlessly share, download, embed and publish
 Easily generate QR codes for your designs
- Design stylemodern
- Colorslight
- SizeCustom (816 x 2300 px)
- File typePNG, PDF, PowerPoint
- Planfree
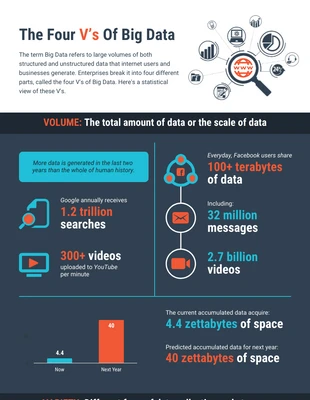
Break down important data or statistics with this Data Infographic Template. The infographic can be fully edited from the pictures to the color scheme. Keep the existing layout or alter it to fit your subject. Consider using a modern color palette or choose colors that work with the images. Alter the graphic images with pictures from our gallery or upload your own. Make the statistical infographic easy to follow by breaking it into sections. You can do this with text boxes for the titles and adding icons to represent the category. Additionally, you can also include bullet lists to highlight details. Use the existing font or choose another modern font that's easy to read. Pair visuals with your different sections to make your content easy to remember. That's all there is to it. Not the infographic for you? Well, check out huge infographic template library with thousands of different designs to choose from. For the perfect infographic template, you've definitely come to the right place!
Related Infographic Templates
statistical infographics
statistical infographics

health infographics
technology infographics

statistical infographics
list infographics
statistical infographics
marketing infographics
statistical infographics
product infographics
research infographics
circle infographics