
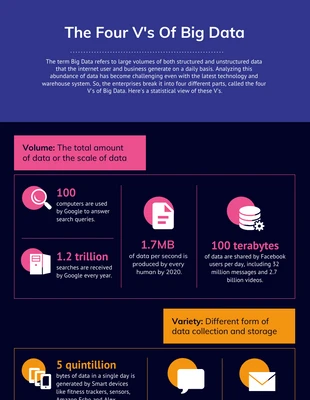
Big Data Statistical Infographic Template
Compose a vivid statistical infographic and more by personalizing this Big Data Statistical Infographic Template

 100% customizable templates
 Millions of photos, icons, charts and graphics
 AI-powered editing features
 Effortlessly share, download, embed and publish
 Easily generate QR codes for your designs
 Accessible and WCAG-compliant
- Design stylemodern
- Colorsdark
- SizeCustom (816 x 2785 px)
- File typePNG, PDF, PowerPoint
- Planpremium
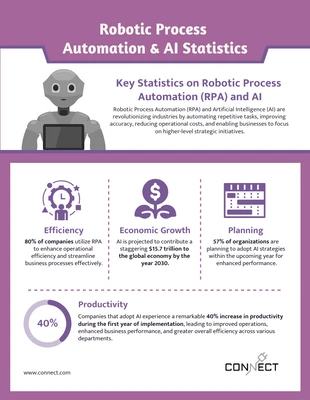
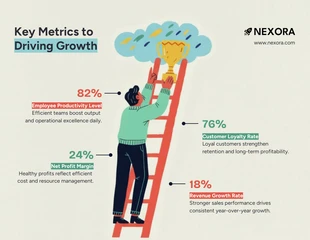
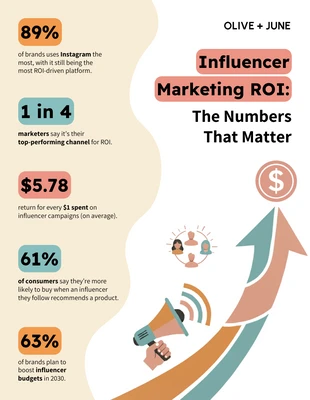
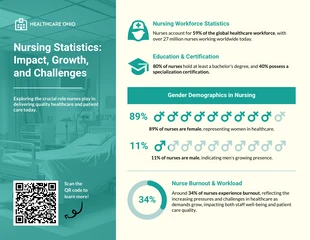
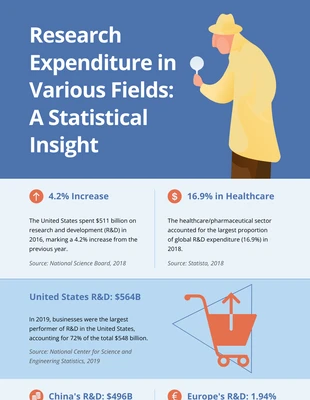
Design a colorful statistical infographic and more with this Big Data Statistical Infographic Template. You can edit everything from the text to the colors. This infographic features a dramatic color scheme, icons, and shapes that you can modify within minutes! Apply a dramatic color scheme in order to make a bold impact. People are instantly drawn to dramatic colors and Venngage has a large collection of dramatic color palettes you can select from. For something more unique, consider crafting your own color scheme with the colors that work for your Big Data Statistical Infographic Template. After you enter new text, incorporate icons to let the readers visualize the content and to break up large amounts of text into sections. The Venngage gallery has thousands of icons that will help you make a captivating infographic. Another way to make the infographic more readable is by utilizing shapes to frame each section of text. Venngage has you covered with a wide variety of shapes, so don't hesitate to try different ones until you get the perfect look. Get started now!
Related Infographic Templates
statistical infographics
statistical infographics
statistical infographics
technology infographics
statistical infographics
list infographics
travel infographics
statistical infographics
statistical infographics
statistical infographics
statistical infographics
research infographics