
Tree Map Chart Template for Global Censorship
Unleash Your Creativity: Design Your Own Tree Map Chart to Visualize Global Censorship Dynamics

 100% customizable templates
 Millions of photos, icons, charts and graphics
 AI-powered editing features
 Effortlessly share, download, embed and publish
 Easily generate QR codes for your designs
- SizeLetter (8.5 x 11 in)
- File typePNG, PDF, PowerPoint
- Planfree
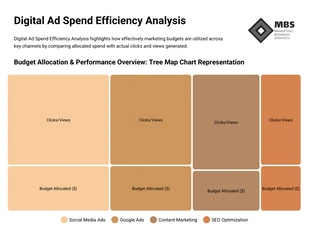
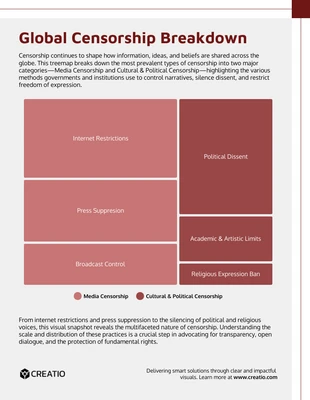
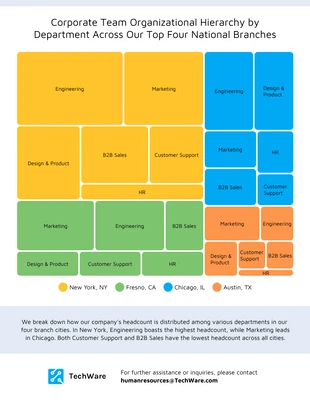
Spotlight global censorship trends with our Tree Map Chart Template. This sleek and intuitive design provides a comprehensive overview of how censorship varies across different regions and topics, perfect for educators, journalists, and researchers looking to convey complex data. Dive into customization with ease—adjust colors to match your brand, resize elements to emphasize key areas, and select from our vast collection of free stock images and icons to enhance your narrative. Whether presenting at a conference or publishing a report, this template is the ideal design to promote and get the word out! With Venngage’s easy editing tools, transform your data into a visual story, making it accessible and engaging for your audience. Let your creativity take the wheel and craft a powerful visual that commands attention and sparks conversation.
Related Chart Templates
tree map charts
tree map charts
tree map charts
tree map charts
tree map charts
tree map charts
tree map charts
tree map charts
tree map charts
tree map charts
tree map charts
tree map charts