Free Line Chart Template
Visually track a trend data over intervals of time using our line graph template.

 100% customizable templates
 Millions of photos, icons, charts and graphics
 AI-powered editing features
 Effortlessly share, download, embed and publish
 Easily generate QR codes for your designs
- Design stylemodern
- Colorslight
- SizeCustom (640 x 640 px)
- File typePNG, PDF, PowerPoint
- Planpremium
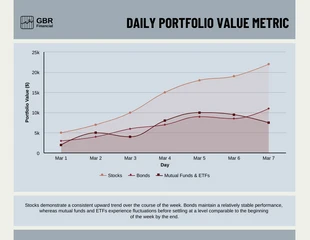
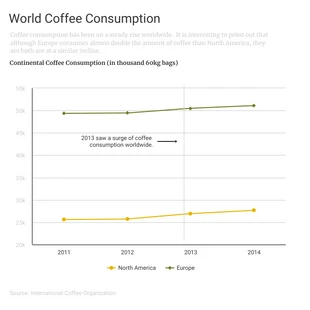
This line graph template from Venngage is ready for you to customize! Line graphs are line charts that can be used for a variety of data sets. An example would be line graphs showing price over time, or line graphs showing percentages over time. Line graphs are great to illustrate comparisons by time periods because they allow people to see the linear relationship between two different values and understand changes and trends over time. Line graphs quickly caught on as a way for businesses and other organizations to present statistical information about their operations or those things that influence them because line charts are such an effective way to visualize data. Through line graphs template we can help all kinds of businesses and organizations to understand their data, increase engagement with customers and stakeholders, communicate information more effectively, improve internal operations, that present information clearly and accurately. Design a professional line graph using Venngage’s line graph template. Non-designers can easily create a professional looking graph without any design experience. All they have to do is input the data and choose
Related Chart Templates
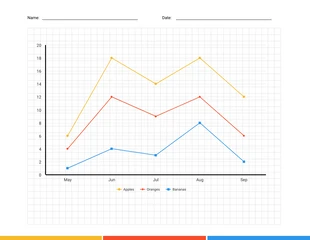
line charts
line charts
area charts
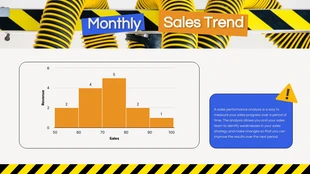
histogram charts
line charts
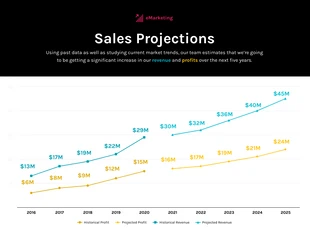
line charts
editorial charts
line charts
line charts