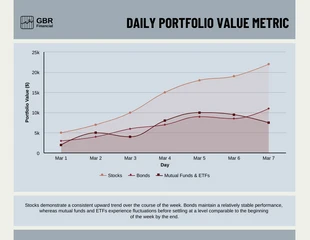
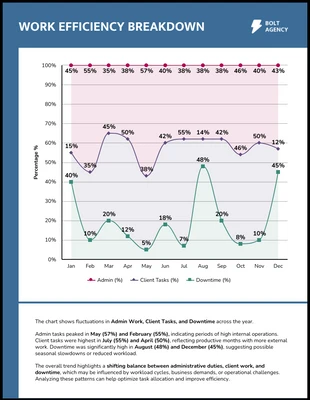
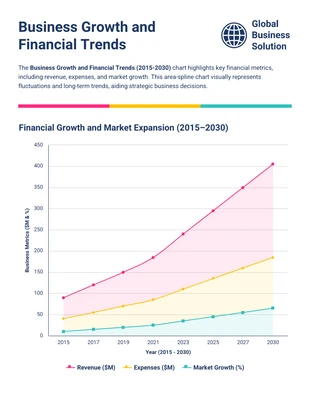
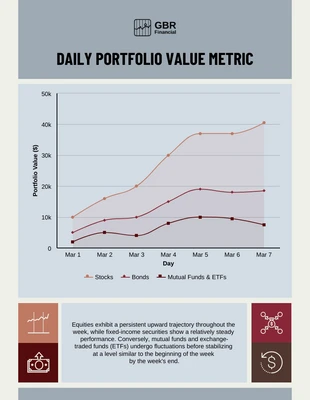
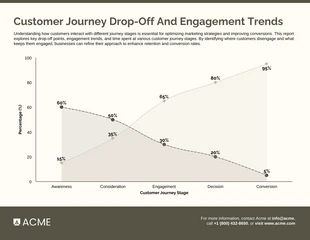
Daily Portfolio Value Area Spline Chart
Unleash Your Creativity: Craft Your Unique Design or Build Your Masterpiece

 100% customizable templates
 Millions of photos, icons, charts and graphics
 AI-powered editing features
 Effortlessly share, download, embed and publish
 Easily generate QR codes for your designs
- SizeLetter (11 x 8.5 in)
- File typePNG, PDF, PowerPoint
- Planpremium
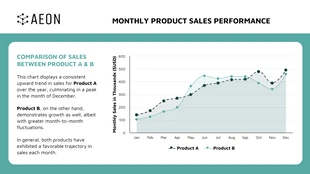
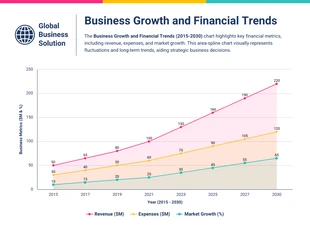
Looking to showcase your investment prowess or provide a visual summary of your portfolio's daily fluctuations? This Daily Portfolio Value Area Spline Chart Template is the perfect tool to keep your data well-organized and visually engaging. With its sleek design and user-friendly interface, you can effortlessly illustrate the rising and falling trends of your assets over time. Designed for flexibility, customize this template to suit your specific needs - tweak the colors, modify the sizes, and pick the most impactful photos or icons from our vast free stock libraries. Whether you're a financial analyst, an investor, or someone simply looking to track and present financial data compellingly, this template is the ideal design to promote and get the word out! Create your ideal design in Venngage and watch your information
Related Chart Templates
area charts
area charts
stacked charts
stacked charts
stacked charts
stacked charts
area charts