
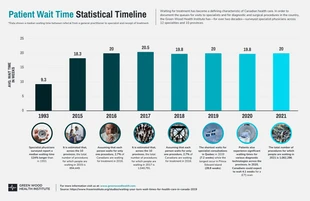
Patient Wait Time Statistical Timeline Infographic Template
Personalize this Patient Wait Time Statistical Timeline Infographic Template for a detailed statistical timeline and more

 100% customizable templates
 Millions of photos, icons, charts and graphics
 AI-powered editing features
 Effortlessly share, download, embed and publish
 Easily generate QR codes for your designs
- Design stylemodern
- Colorslight
- SizeTabloid (17 x 11 in)
- File typePNG, PDF, PowerPoint
- Planbusiness
Breakdown a statistics timeline and more with this editable Patient Wait Time Statistical Timeline Infographic Template. It's easy to customize within minutes and features photos, shapes, and a gradient color scheme. Make the timeline intriguing and simple to follow by adding photos. The Venngage gallery is packed with high-quality stock photos that will allow readers to visualize the content. You can easily insert them and adjust their size to meet your preferences. Clearly explain statistics and data by utilizing shapes. You can also use shapes to frame the photos and there is a wide selection of shapes and styles to pick from. Whether you opt for professional or dramatic colors, consider applying a gradient color scheme for a unique look. Choose one of Venngage's automated color palettes, or make your own color scheme for a more personalized touch. Have questions about the Patient Wait Time Statistical Timeline Infographic Template? Contact Venngage today and we'll be happy to help!
Related Infographic Templates
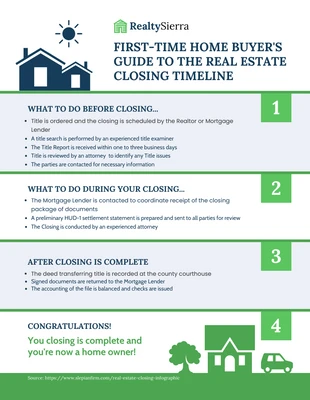
real estate infographics
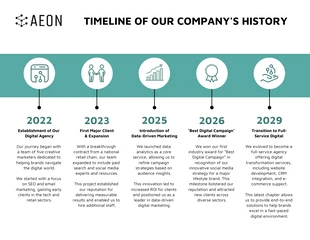
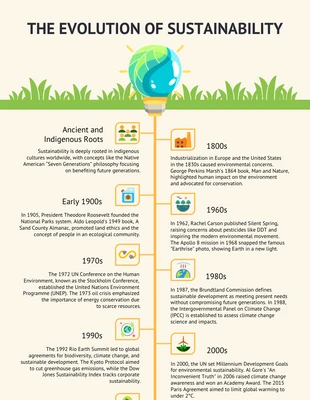
timeline infographics
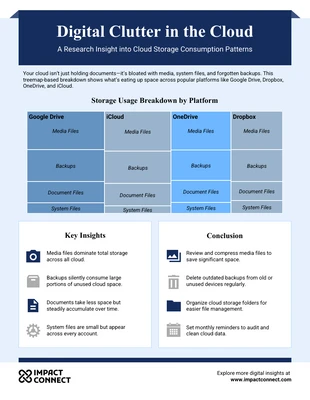
research infographics
timeline infographics

real estate infographics
timeline infographics
timeline infographics
timeline infographics
history infographics
statistical infographics
timeline infographics

timeline infographics