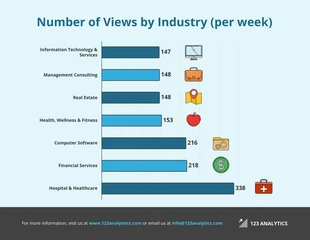
Number of Views by Industry Comparison Infographic Template
Personalize this Number of Views by Industry Comparison Infographic Template for a clean industry comparison infographic and more
100% customizable templates
Millions of photos, icons, charts and graphics
AI-powered editing features
Effortlessly share, download, embed and publish
Easily generate QR codes for your designs
- Design stylemodern
- Colorslight
- SizeLetter (11 x 8.5 in)
- File typePNG, PDF, PowerPoint
- Planfree
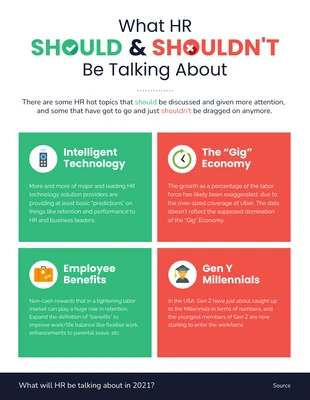
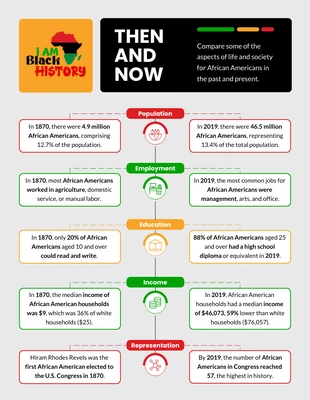
Generate a traditional industry comparison infographic and more with this editable Number of Views by Industry Comparison Infographic Template. Personalize the comparison infographic with images, bold text, and a professional color scheme for a simple look. Make sure the content is easy to understand by applying images that represent each statistic in the bar chart. Search the Venngage gallery for the perfect images for the Number of Views by Industry Comparison Infographic Template and add them with a click. As for the content, use bold text to draw attention to vital details such as the title or headings for each item in the comparison infographic. Simply highlight the text and choose the bold option for an instant transformation. Choose a professional color scheme that isn't distracting and lets the reader focus on the content. It's easy to customize your own color palette, or you can pick one of the professional color schemes on Venngage. Start modifying the comparison infographic template today!


