 Symbols Infographic Template")
Data Flow Diagram (DFD) Symbols Infographic Template
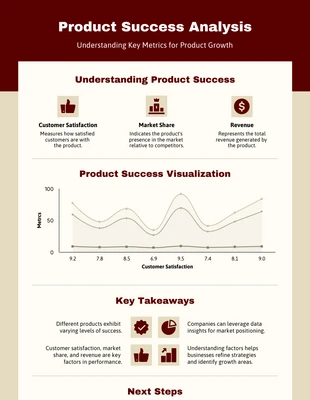
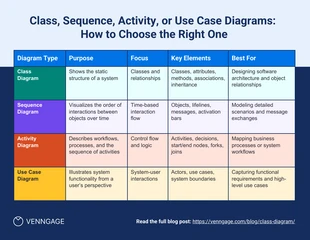
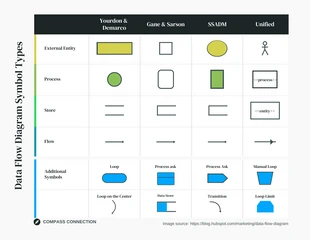
The "Data Flow Diagram (DFD) Symbols Infographic Template" compares different DFD symbols used by methodologies like Yourdon & DeMarco, Gane & Sarson, SSADM, and Unified. The template features a clean layout with rows for external entities, processes, stores, and flows, along with additional symbols. This template helps in understanding various DFD notations. Customize it using our tool to fit your specific needs. Explore our library for more free templates to enhance your data modeling presentations.

 100% customizable templates
 Millions of photos, icons, charts and graphics
 AI-powered editing features
 Effortlessly share, download, embed and publish
 Easily generate QR codes for your designs
- SizeLetter (11 x 8.5 in)
- File typePNG, PDF, PowerPoint
- Planpremium
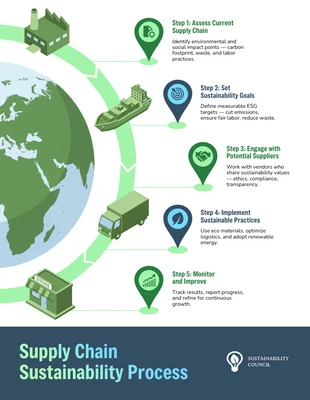
The purpose of creating Data Flow Diagram (DFD) symbols is to visually represent the flow of data within a system or process. By using standardized symbols, DFDs help in understanding the complex relationships between different components, processes, and data sources, making it easier to identify potential problems, analyze systems, and design more efficient processes. In essence, DFD symbols serve as a systematic and graphical communication tool that helps analysts, developers, and stakeholders gain clarity on system functionality and optimize its performance.
Related Infographic Templates

safety infographics

statistical infographics

circle infographics
product infographics

process infographics
list infographics

circle infographics

process infographics

fun data infographics
comparison infographics
process infographics
informational infographics