
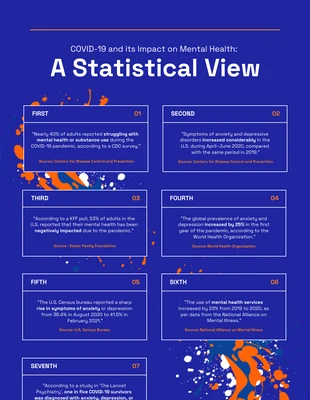
Covid-19 Statistical View Infographic Template
Unleash your creativity! Design your own impactful Covid Statistical Infographic now!

 100% customizable templates
 Millions of photos, icons, charts and graphics
 AI-powered editing features
 Effortlessly share, download, embed and publish
 Easily generate QR codes for your designs
- SizeTabloid (11 x 17 in)
- File typePNG, PDF, PowerPoint
- Planfree
Looking to make a splash with insightful data? The Blue and Orange Paint Splat Covid Statistical Infographic Template is the perfect tool. This expertly designed template is an ideal platform for showcasing critical Covid-19 statistical data in a visually enticing manner. With a vibrant blend of blue and orange paint splat graphics, your stats are sure to grab attention! Tailor the template according to your requirements - dazzle with different shades, play with the size of elements, and pick the most fitting photos or icons from our richly stocked library to create your ideal design. Venngage's flexible customization options give you the freedom to make the template uniquely yours. Promote and spread your message effectively with this eye-catching infographic template!
Related Infographic Templates
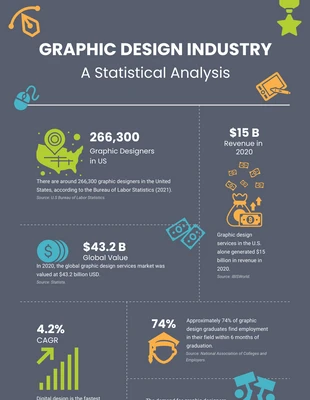
graphic design infographics
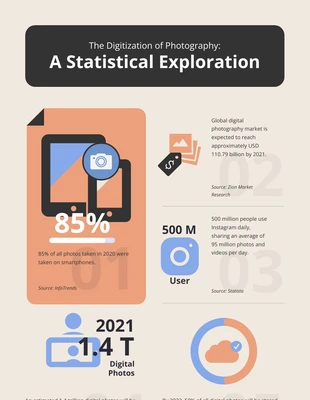
photography infographics
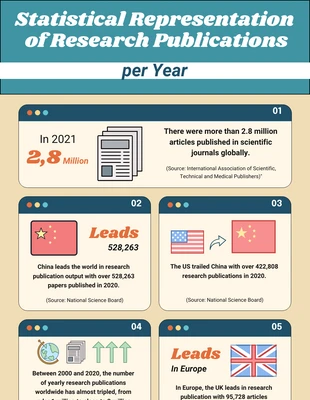
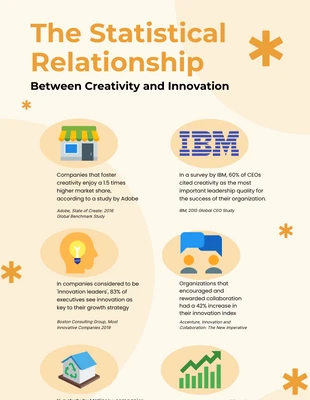
research infographics
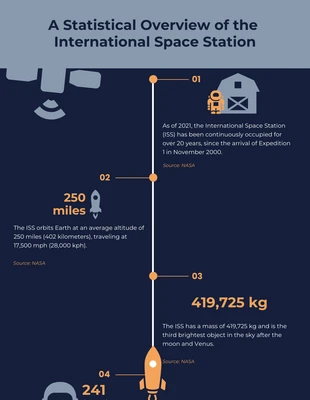
space infographics
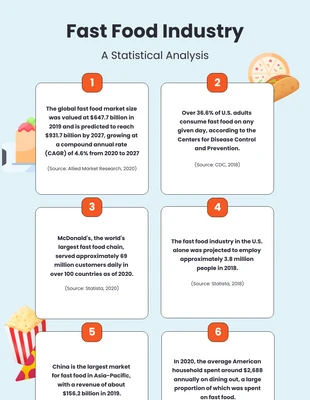
food infographics
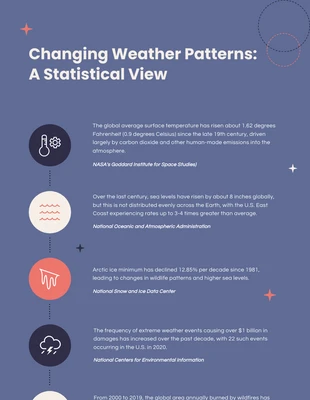
science infographics
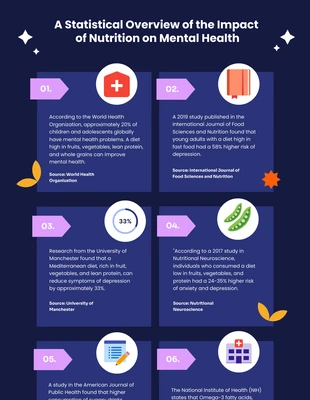
nutrition infographics
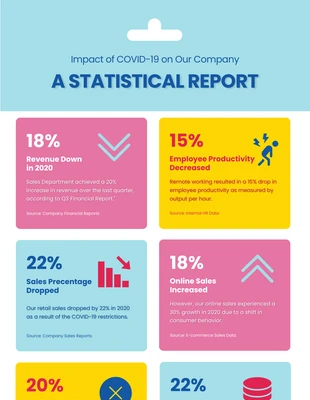
company infographics
covid infographics
creative infographics
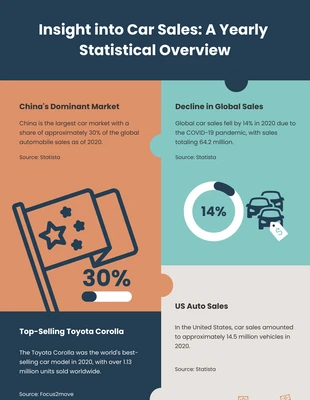
car infographics
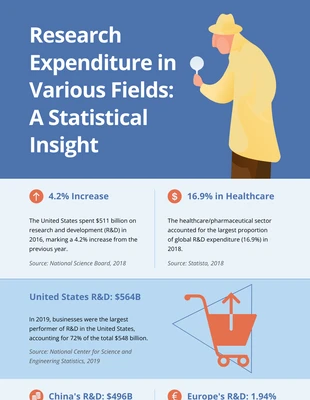
research infographics