
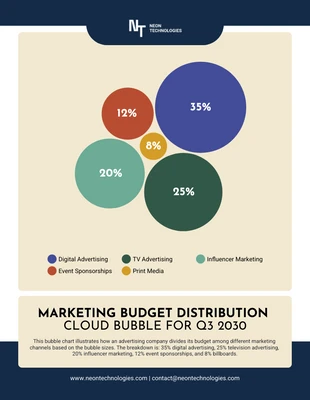
Renewable Energy Efficiency Scatter Bubble Chart
Unleash Your Creativity: Design Your Own Renewable Energy Efficiency Scatter Bubble Chart

 100% customizable templates
 Millions of photos, icons, charts and graphics
 AI-powered editing features
 Effortlessly share, download, embed and publish
 Easily generate QR codes for your designs
 Accessible and WCAG-compliant
- SizeLetter (11 x 8.5 in)
- File typePNG, PDF, PowerPoint
- Planpremium
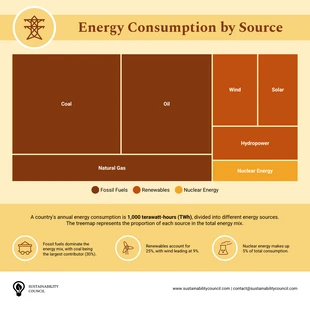
The Renewable Energy Efficiency Scatter Bubble Chart Template is a dynamic tool tailor-made for visualizing complex data with ease. Perfect for presenting how various renewable energy sources compare in efficiency and output, this chart empowers you to convey critical insights at a glance. Whether you're in academia, a start-up, or a corporate environment, this template gets your message across loud and clear. It’s the ideal design to promote and get the word out! Dive into customization: adjust colors, tweak sizes, and select fitting photos or icons from Venngage’s free stock libraries to bring your vision to life. Ready to make your data pop and engage your audience? The perfect scatter bubble chart is just a few clicks away with Venngage!
Related Chart Templates
bubble charts
table charts
bubble charts
tree map charts
stacked charts
stacked charts
tree map charts
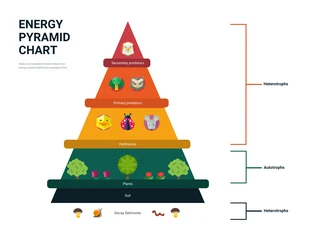
pyramid charts
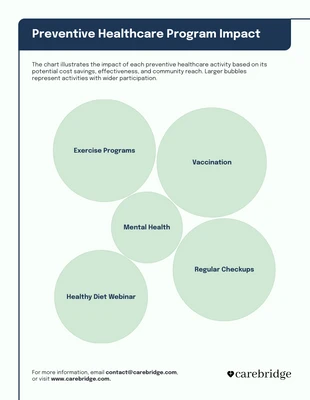
bubble charts
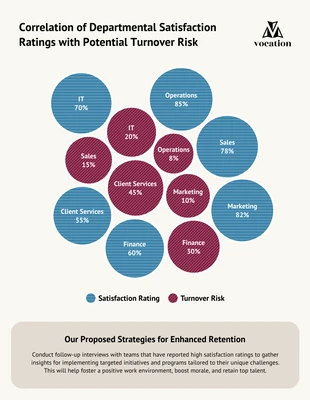
bubble charts