
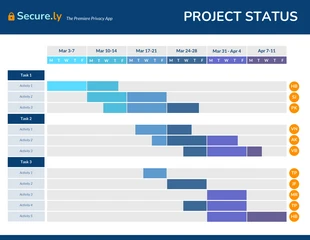
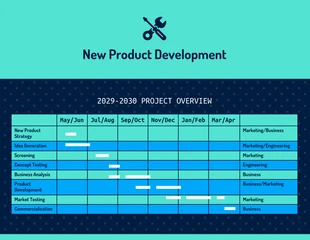
New Product Project Gantt Chart PPT Template
Design Product data using our infographic template Powerpoint gantt chart

 100% customizable templates
 Millions of photos, icons, charts and graphics
 AI-powered editing features
 Effortlessly share, download, embed and publish
 Easily generate QR codes for your designs
- Design stylemodern
- Colorslight
- SizeCustom (1056 x 550 px)
- File typePNG, PDF, PowerPoint
- Planfree
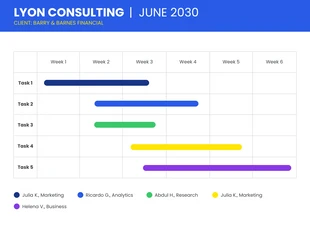
In a PowerPoint Gantt Chart template, the horizontal axis represents time and the vertical axis shows progress. Most typically, a Gantt Chart is divided into multiple columns for each project task by category–namely, ""to do,"" ""doing"" and ""done."" It's an alternative to Excel or another spreadsheet software if you're looking for a way to create an engaging project timeline. Not crazy about the color scheme? The Venngage editor lets you apply a different color scheme to the template in one click. Open the “My Brand Kit” tab to explore different custom color palettes After you download Venngage's template, simply follow the instructions in the Venngage video above to create your own personal Gantt Chart in no time! Now that you know how to customize a PowerPoint gantt chart, let's explore what you can do with Venngage's PowerPoint gantt chart template . Click create to get started. Sign up for a free account and you'll get taken to the editor to customize this template. After you've opened Venngage's Gantt Chart Template for PowerPoint , you will see three timelines that are basically three projects. The three
Related Diagram Templates
gantt diagrams
gantt diagrams
gantt diagrams
gantt diagrams
gantt diagrams
gantt diagrams
gantt diagrams
gantt diagrams
gantt diagrams
gantt diagrams
gantt diagrams
gantt diagrams