
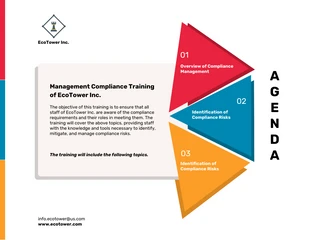
Triangle Infographic Template
Transform complex information into something more easily digestible and visually engaging by customizing this triangle infographic.

 100% customizable templates
 Millions of photos, icons, charts and graphics
 AI-powered editing features
 Effortlessly share, download, embed and publish
 Easily generate QR codes for your designs
- Design stylemodern
- Colorslight
- SizeLetter (11 x 8.5 in)
- File typePNG, PDF, PowerPoint
- Planpremium
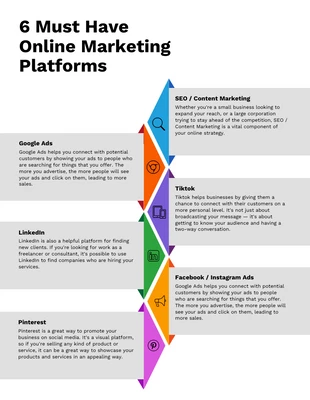
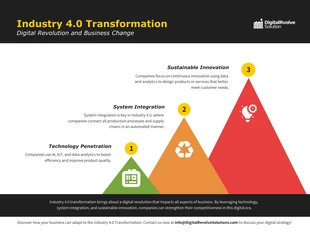
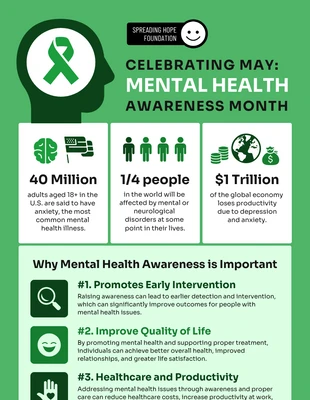
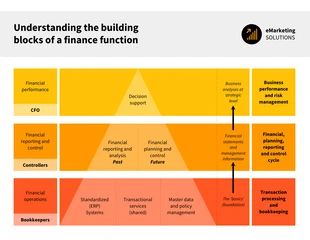
An infographic is a visual representation of data or information. It is a pictorial way to display information that is engaging and easy to understand. Infographics make complex data more coherent and easily digestible. They use charts, graphs, images, and other visuals to more attractively display information. They can effectively communicate educational content, data visualizations, or marketing material. There are many types of infographics according to function and style. One of them is the triangle infographic. It is a visual representation of data or information that uses a triangular layout. The triangle infographic effectively conveys messages that require both images and text. This kind of infographic aims to communicate a message using three steps. The three sides of the triangle represent different aspects of the information. Most of the time, the first side represents the main point, the second side represents supporting details, and the third represents additional details or concluding information. If the idea of making a triangle infographic from scratch is stressing you out, you can find templates online to guide you. There are several triangle infographic templates you can
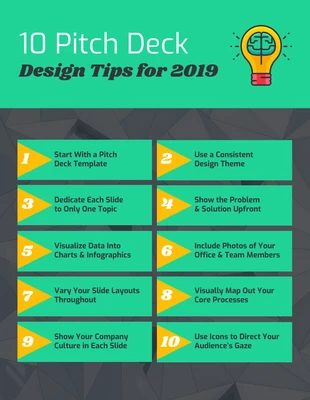
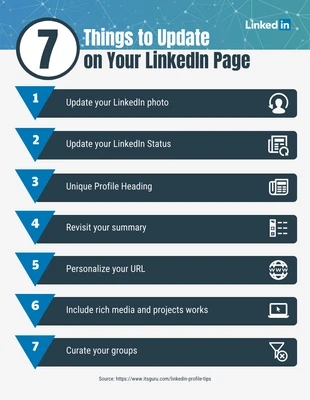
Related Infographic Templates
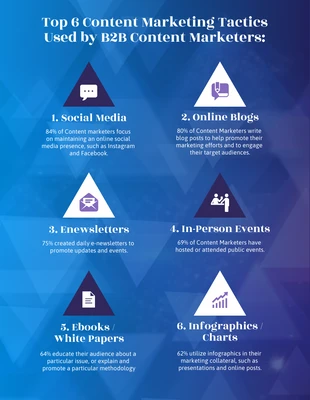
list infographics
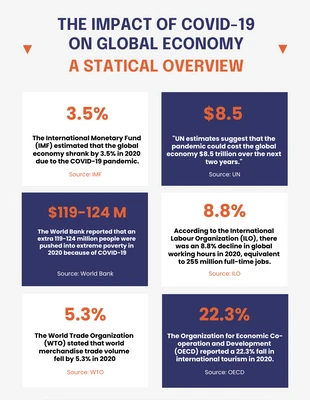
covid infographics
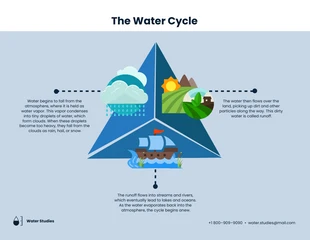
water infographics
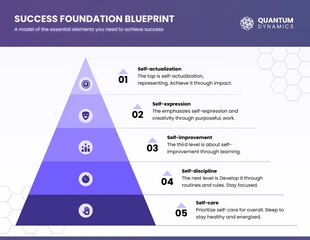
success infographics
informational infographics
list infographics
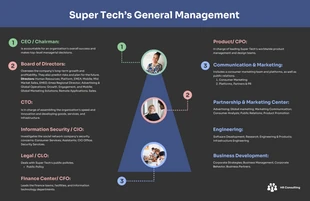
human resources infographics
list infographics
informational infographics
mountain infographics
mental health infographics
business infographics