Te Papa Green Real Estate Digital Trends Infographic Template
Develop an impressive real estate infographic and more by editing this Real Estate Digital Trends Infographic Template
100% customizable templates
Millions of photos, icons, charts and graphics
AI-powered editing features
Effortlessly share, download, embed and publish
Easily generate QR codes for your designs
- Design stylemodern
- Colorsdark
- SizeLetter (8.5 x 11 in)
- File typePNG, PDF, PowerPoint
- Planpremium
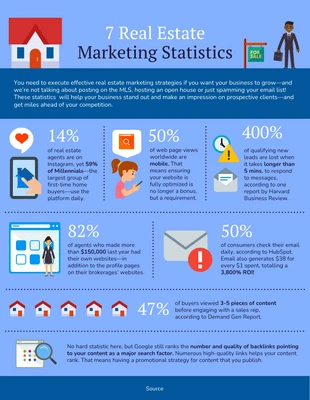
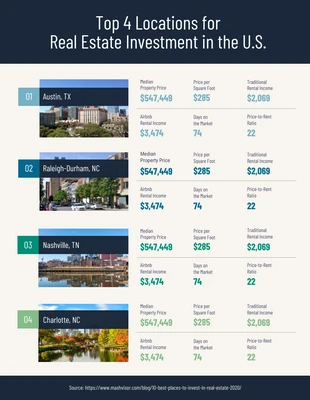
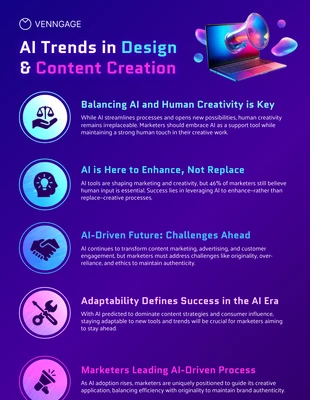
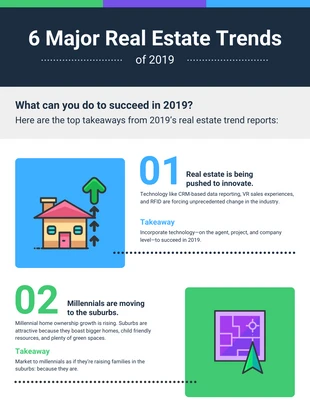
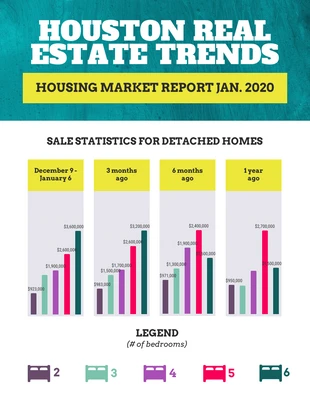
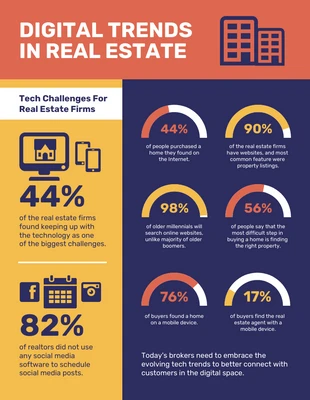
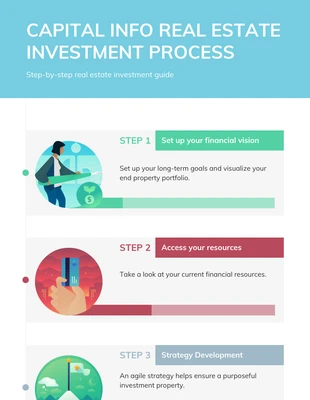
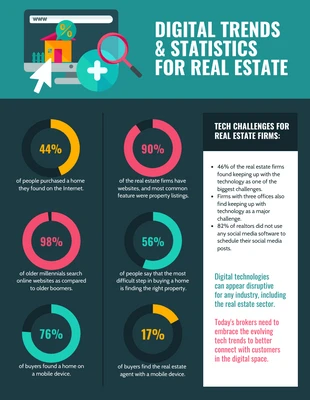
Create a real estate trend guide and more with this Real Estate Digital Trends Infographic Template. Easily incorporate charts, a vibrant color palette, and icons to help explain the information. Start off by inserting charts that will effectively help people visualize the content. Charts are great for breaking up large amounts of complex data and Venngage has a variety of charts to choose from. All you have to do is enter the details manually or upload a file and see your data magically transform into the charts. Information is more easily processed when it's presented in a memorable way and you can do that with a vibrant color palette. Select one of the existing color palettes available on Venngage or make your own color scheme with the colors that fit your Real Estate Digital Trends Infographic Template. Another way to make your content easier to understand is by applying icons. The Venngage gallery has thousands of creative icons that will let your real estate infographic really stand out. Get started on your design now!

