
Rainy Days Infographic Template
Graph out weather statistics with this Rainy Season Infographic Template

 100% customizable templates
 Millions of photos, icons, charts and graphics
 AI-powered editing features
 Effortlessly share, download, embed and publish
 Easily generate QR codes for your designs
- Design stylemodern
- Colorsvibrant
- SizeCustom (816 x 983 px)
- File typePNG, PDF, PowerPoint
- Planfree
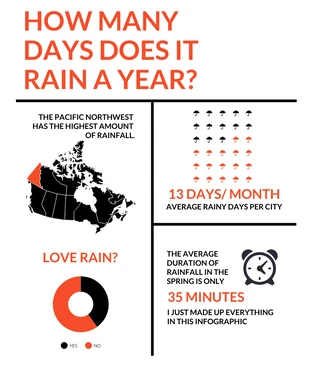
Compose a spectacular weather infographic and more with this Rainy Season Infographic Template. Apply icons, choose a minimal color palette, and add bold headings for a simple, yet eye-catching infographic. Icons are a great technique to express data and to help the reader visualize the content. Look through the Venngage gallery or search by name and insert the icons into the season infographic with one click. Opt for a minimal color palette for the Rainy Season Infographic Template so the data pops off the page. You can use a single color to reflect the data and Venngage has several automated minimal color palettes to select from. You can also make your own color scheme from scratch and then apply it to the weather infographic. Put the finishing touches on the Rainy Season Infographic Template by integrating bold headings. Bold typeface will instantly grab attention and you can use it to direct the reader's gaze down the page. Get started editing your own infographic today!
Related Infographic Templates
informational infographics

yoga infographics

informational infographics

list infographics
informational infographics
history infographics
list infographics
comparison infographics

timeline infographics

wedding infographics
list infographics
statistical infographics