
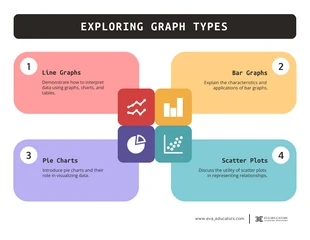
Exploring Graph Types In Math Infographic Template
Unleash your creativity by designing your own unique math infographic using our template!

 100% customizable templates
 Millions of photos, icons, charts and graphics
 AI-powered editing features
 Effortlessly share, download, embed and publish
 Easily generate QR codes for your designs
- SizeLetter (11 x 8.5 in)
- File typePNG, PDF, PowerPoint
- Planpremium
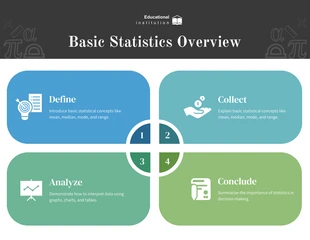
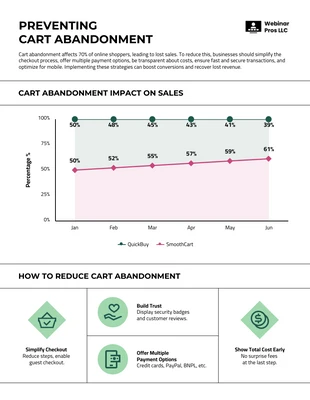
The Exploring Graph Types for Math Infographic Template is a fantastic tool for educators and professionals seeking to showcase complex mathematical data in an engaging way. This template is designed to help you explain divergent graph types with clarity and style. It is brimming with potential for customization. You can add a splash of color, resize it to suit your presentation, and search our free stock libraries for the perfect photos or icons to accentuate your data. Use this template to promote your work or teaching materials, and get your message across effectively. With Venngage, creating your ideal design has never been easier.
Related Infographic Templates
math infographics
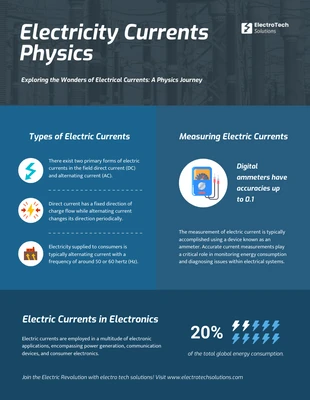
physics infographics
research infographics
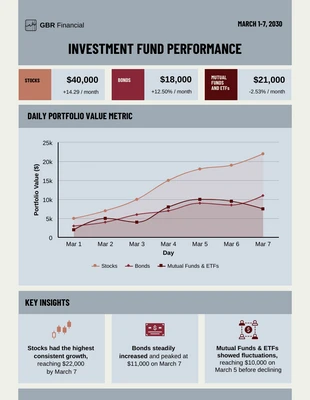
finance infographics
business infographics
graphic design infographics
product infographics
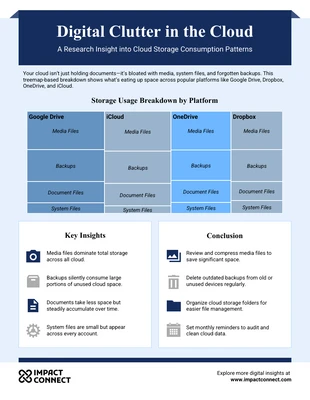
cloud infographics

comparison infographics
math infographics
marketing infographics

finance infographics