
Food Drink Influence on Life Infographic Template
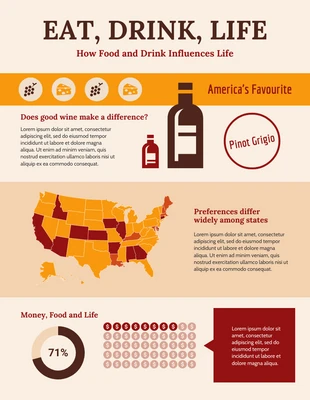
Food is life! Show how it influences people with this editable Food and Drink Statistical Infographic Template.

 100% customizable templates
 Millions of photos, icons, charts and graphics
 AI-powered editing features
 Effortlessly share, download, embed and publish
 Easily generate QR codes for your designs
- Design styleretro
- Colorsdark, vibrant
- SizeLetter (8.5 x 11 in)
- File typePNG, PDF, PowerPoint
- Planpremium
Analyze life influences and more with this Food and Drink Statistical Infographic Template. Personalize the data infographic with icons, a contrasting color palette, and charts. Utilize icons for your statistical infographic in order to make the information more interesting and to express the content. Venngage has a vast collection of icons that will help make your Food and Drink Statistical Infographic Template look impressive. Make the content jump off the page by incorporating a contrasting color palette. There's several pre-generated contrasting color palettes available on Venngage, or you can opt to make your own for the data infographic. Another way you can help the readers visualize the statistics is by inserting charts into the infographic. You can upload a file, choose the chart and watch the information transform on the infographic. Do you have questions about the Food and Drink Statistical Infographic Template? Contact Venngage and we'll be glad to answer your infographic design questions!
Related Infographic Templates
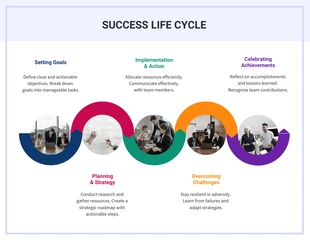
success infographics
human resources infographics
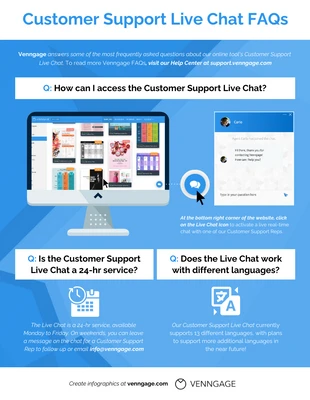
informational infographics
informational infographics
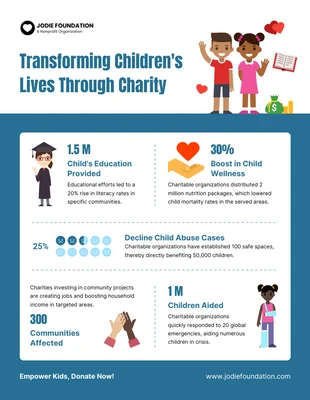
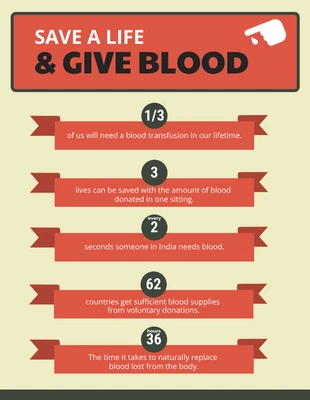
charity infographics
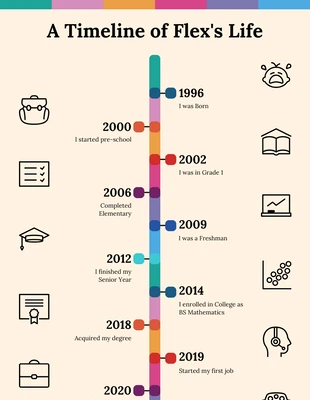
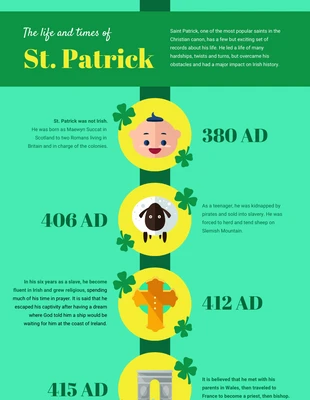
timeline infographics
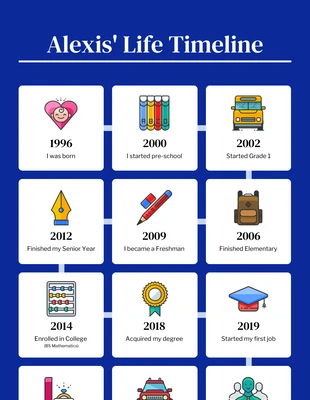
timeline infographics
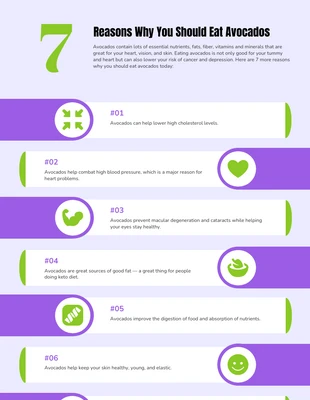
list infographics
nonprofit infographics
timeline infographics
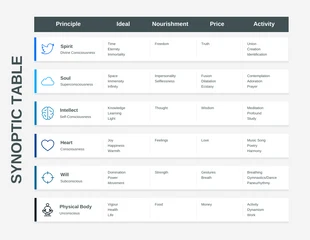
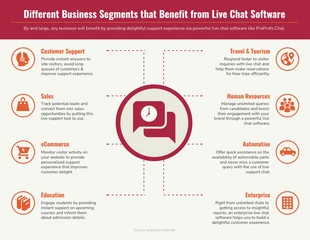
comparison infographics
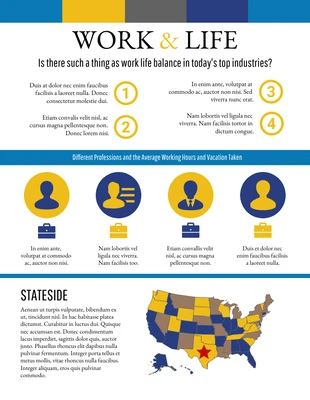
statistical infographics