
Data Storytelling Benchmark Report Infographic Template
Compose an outstanding data storytelling infographic by customizing this Data Storytelling Benchmark Report Statistical Infographic Template

 100% customizable templates
 Millions of photos, icons, charts and graphics
 AI-powered editing features
 Effortlessly share, download, embed and publish
 Easily generate QR codes for your designs
- Design stylemodern
- Colorsdark
- SizeCustom (816 x 5700 px)
- File typePNG, PDF, PowerPoint
- Planfree
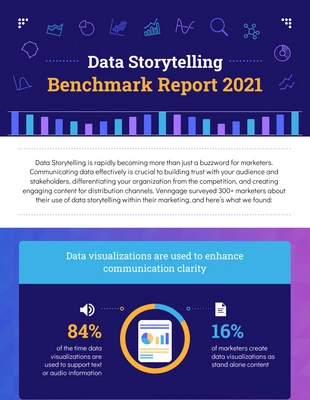
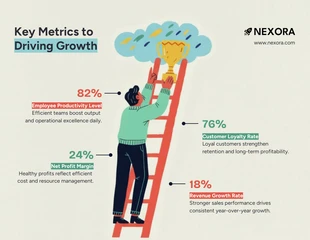
Share interesting data storytelling statistics and more with this Data Storytelling Benchmark Report Statistical Infographic Template. Customize the infographic with charts, icons, and a dramatic color palette for an exciting design. Begin editing the statistical infographic with charts to display your data. You can select from a variety of charts on Venngage from bar charts to pie charts and you can upload a data sheet with one click! Next, apply icons to make the Data Storytelling Benchmark Report Statistical Infographic Template easier to follow. Icons are perfect for communicating content and Venngage has thousands of icons you can select from and you can also resize them and frame them with shapes! Finish up your statistical infographic by applying a dramatic color palette so it jumps out at the reader. Create a color palette with the colors you want, or use one of Venngage's pre-generated dramatic color schemes for your infographic. Get started today!
Related Infographic Templates
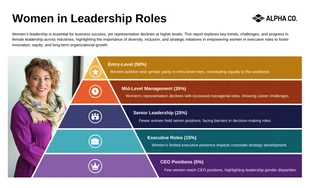
women infographics
statistical infographics
statistical infographics
statistical infographics
marketing infographics
statistical infographics
marketing infographics
informational infographics
statistical infographics
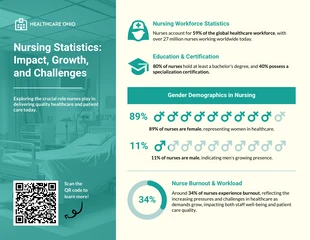
health infographics
research infographics
nutrition infographics