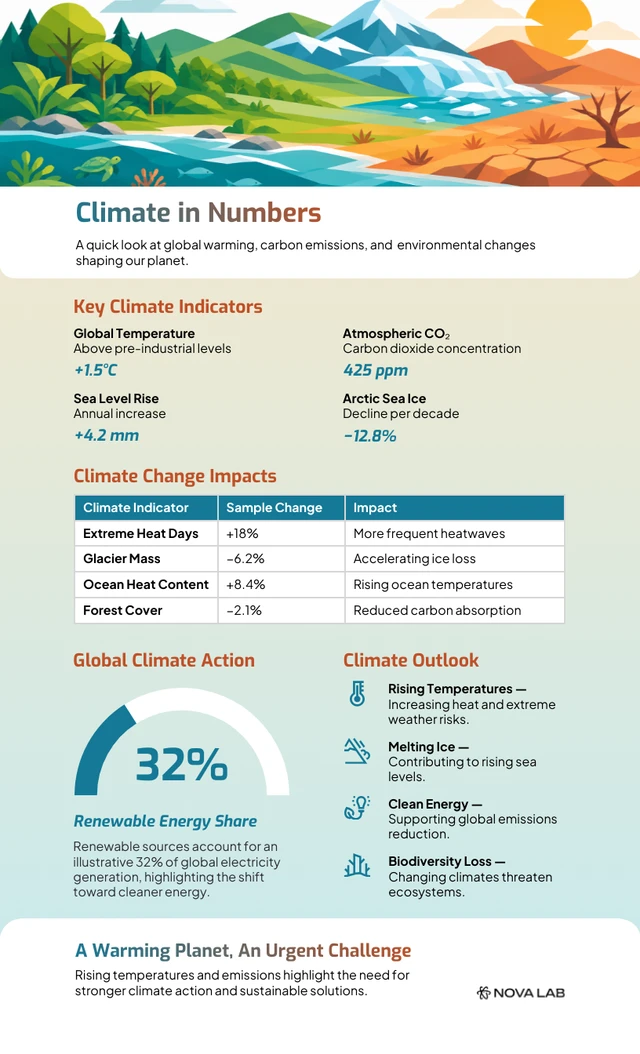
Data-dense Climate Data Snapshot
Quickly capture and visualize complex climate data for clear insights and smart decision-making.

 100% customizable templates
 Millions of photos, icons, charts and graphics
 AI-powered editing features
 Effortlessly share, download, embed and publish
 Easily generate QR codes for your designs
- SizeLegal (8.5 x 14 in)
- File typePNG, PDF, PowerPoint
- Planfree
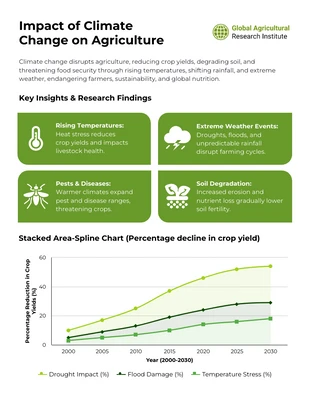
This template helps you create clear summaries of complex climate data. It’s perfect when you want to share key facts and trends without overwhelming your audience.
Use it for reports, newsletters, presentations, or quick updates on temperature, rainfall, greenhouse gases, and more. You can customize numbers, charts, and labels to fit your data and story.
Editing is straightforward. Just plug in your figures and text, and you’ll get a clear, accurate snapshot that highlights important points. You can also adjust headings and descriptions to explain what the data shows.
Once done, this snapshot works well in emails, PDF reports, or online posts. It makes your climate info easier to understand and share.
Try it out to turn complicated data into insights your audience can quickly grasp.