
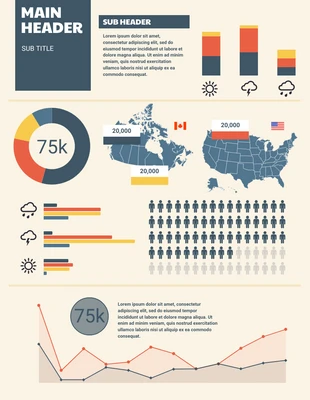
Simple Statistics Infographic Template
Need to display statistical data? Customize this Analytical Statistics Infographic Template within minutes!

 100% customizable templates
 Millions of photos, icons, charts and graphics
 AI-powered editing features
 Effortlessly share, download, embed and publish
 Easily generate QR codes for your designs
- Design styleretro
- Colorsdark
- SizeLetter (8.5 x 11 in)
- File typePNG, PDF, PowerPoint
- Planbusiness
Design a trendy data infographic and more with this Analytical Statistics Infographic Template. Incorporate charts, apply icons, and use a modern color palette for an eye-catching design. Charts are an excellent way to explain the content and make it easier to follow. From pie charts to bar charts, Venngage has a multitude of charts and tables you can use to reinvent your statistical infographic. Next, utilize icons that represent the data and break up the content. There's thousands of incredible stock icons on Venngage, so don't hesitate to add them where you want and resize them for a more refined look. Another technique you can use to transform your data infographic is by selecting a modern color palette that draws the reader's eyes. You can either pick one from Venngage, or make your own modern color palette and add it to the Analytical Statistics Infographic Template. Start modifying your very own statistical infographic today!
Related Infographic Templates
statistical infographics