
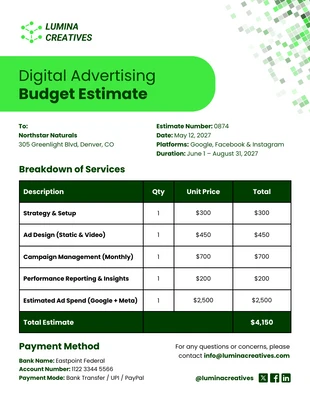
Projected Investment Performance Table Chart
Unleash Your Creativity: Design Your Own Investment Performance Charts!

 100% customizable templates
 Millions of photos, icons, charts and graphics
 AI-powered editing features
 Effortlessly share, download, embed and publish
 Easily generate QR codes for your designs
- SizeLegal (8.5 x 14 in)
- File typePNG, PDF, PowerPoint
- Planbusiness
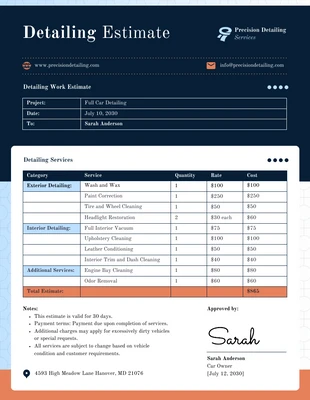
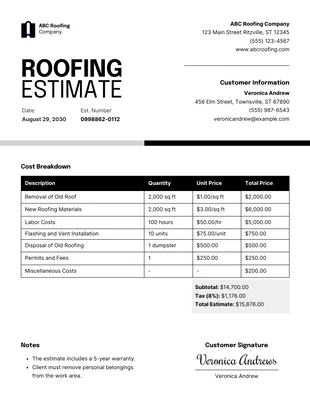
Looking to make your data presentation pop? Our Projected Investment Performance Table Chart Template is just what you need. Perfect for financial presentations, investment pitches, or shareholder meetings, this template delivers clarity and professionalism. It’s an eye-catching way to showcase projected investment returns, helping you dazzle your audience with well-organized information. This template is the ideal design to promote and get the word out! Customize as much as you need — change colors, tweak sizes, and select the perfect photos or icons from our free stock libraries to craft your perfect design in Venngage! Whether it’s a gradual growth graph or a sharp upward trend, you can highlight all crucial data effortlessly. Dive in and make your financial data speak volumes with our easy-to-use design
Related Estimate Templates
marketing estimates
service estimates
finance estimates
finance estimates
service estimates
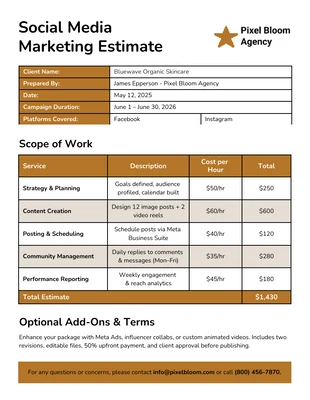
marketing estimates
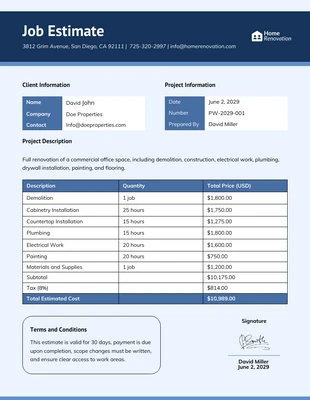
service estimates
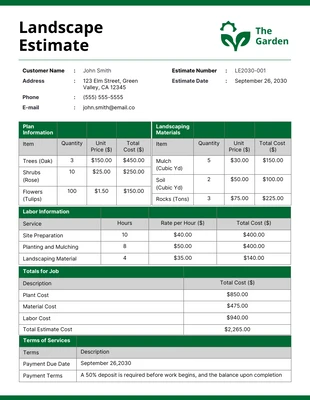
landscape estimates
roof estimates
service estimates
 1/2
1/2service estimates
photography estimates