
Coca Cola's Historical Infographic Template
In order to make history come alive for students, it's often helpful to use some kind of visual aid. Customize this historical infographic from Venngage.

 100% customizable templates
 Millions of photos, icons, charts and graphics
 AI-powered editing features
 Effortlessly share, download, embed and publish
 Easily generate QR codes for your designs
- Design stylemodern
- Colorslight
- SizeCustom (816 x 3450 px)
- File typePNG, PDF, PowerPoint
- Planpremium
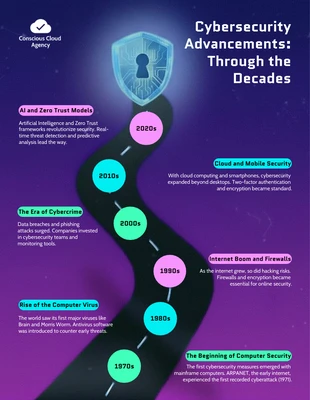
A historical infographic is an informational graphic that presents data related to a historical event, person, or period. It typically uses visual elements like graphs, charts, and maps to present the information in an engaging way. Historical infographics can be used for a variety of purposes, including research purposes, education, entertainment and marketing initiatives. This type of infographic allows people to see how something has changed over time or what happened before another thing occurred. It also helps them understand why certain events happened and how they were connected with other events that occurred around the same time period. Customize your infographic with our easy-to-use drag-and-drop interface that allows you to easily add or remove elements, change fonts, edit text, and more! You don't need to be a designer, have design experience, or download any design tools to customize this infographic—we've done all the hard work for you! Creating an infographic is easy with Venngage. Here's how: Once you've registered for a free membership, you can start using our simple design tool and our extensive template library. The editing process for your infographic is
Related Infographic Templates
timeline infographics
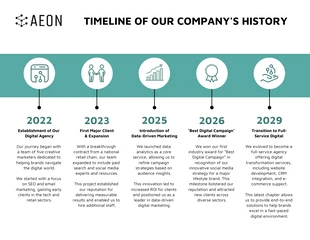
timeline infographics
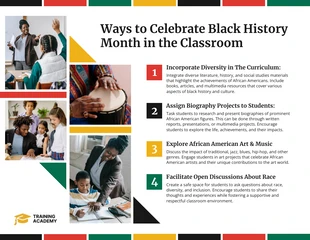
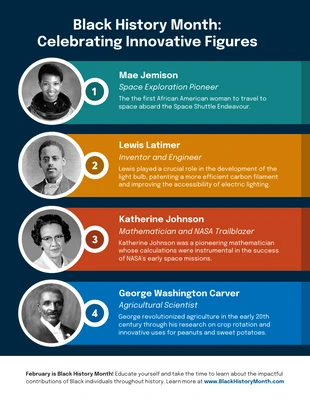
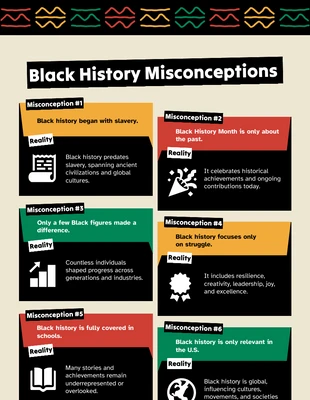
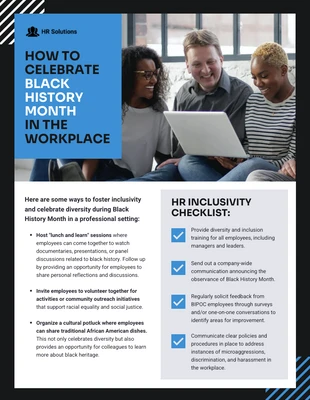
black history month infographics
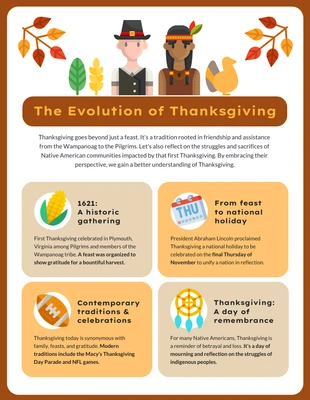
history infographics
black history month infographics
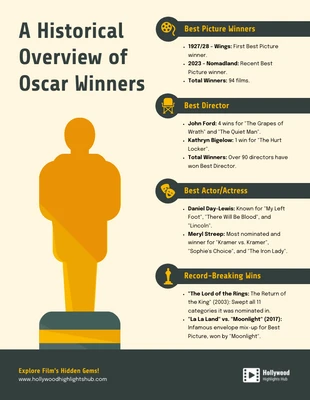
film infographics
black history month infographics
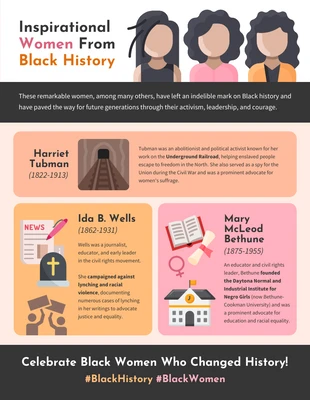
black history month infographics
black history month infographics
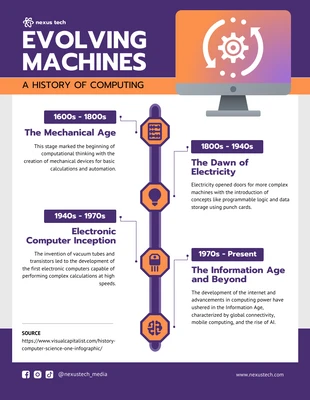
computer infographics
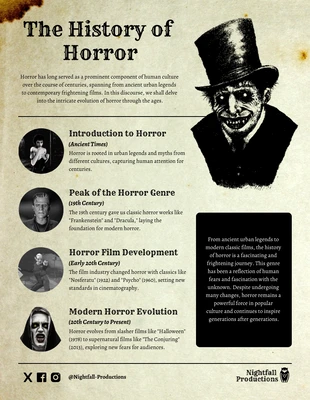
horror infographics
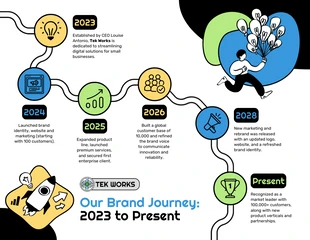
timeline infographics