


Make a Chart Infographic From Any Topic with AI
Type a topic. Watch it become something more fun than a regular chart, sourced and ready to edit.




AI-Powered Tools
How to Create an Infographic Chart using AI in Under 5 Minutes
Step 1
Add your topic and your data
Enter your data and tell the AI what chart you want, or let it pick the best one for you. For example: Create an icon pie chart showing whether Americans think a hot dog is a sandwich: No 53%, Yes 40%, Unsure 7%.
Step 2
Turn your topic into something more interesting than a standard chart
Let the subject shape the visual. Music streams could appear through headphones or vinyl records. Fashion sales could be shown with T-shirts or shoes. The objects become part of how the quantities are represented.
Step 3
Make the infographic chart design your own
Change a value, rewrite a label, swap an object or rearrange the layout without generating everything again. Adjust the colors and fonts or apply your Brand Kit so the final infographic chart feels like yours.
Step 4
Give it a final check before you publish
Look over the finished chart and make sure every value and label reads the way you want. Anything you want to change can be updated directly in the editor.
Step 5
Make it work wherever you plan to use it
Resize your infographic chart for social media, a presentation, blog content or a report. Once it is ready, export it as a PNG or PDF or share it with a link.
Turn Campaign Data Into Infographic Charts People Actually Notice
Give a key stat a visual treatment that fits the story you’re telling. Build an infographic comparison chart using plastic waste or other recognizable products for performance data, then adjust the copy, colors, values and layout to match your brand.
Generate Infographic Charts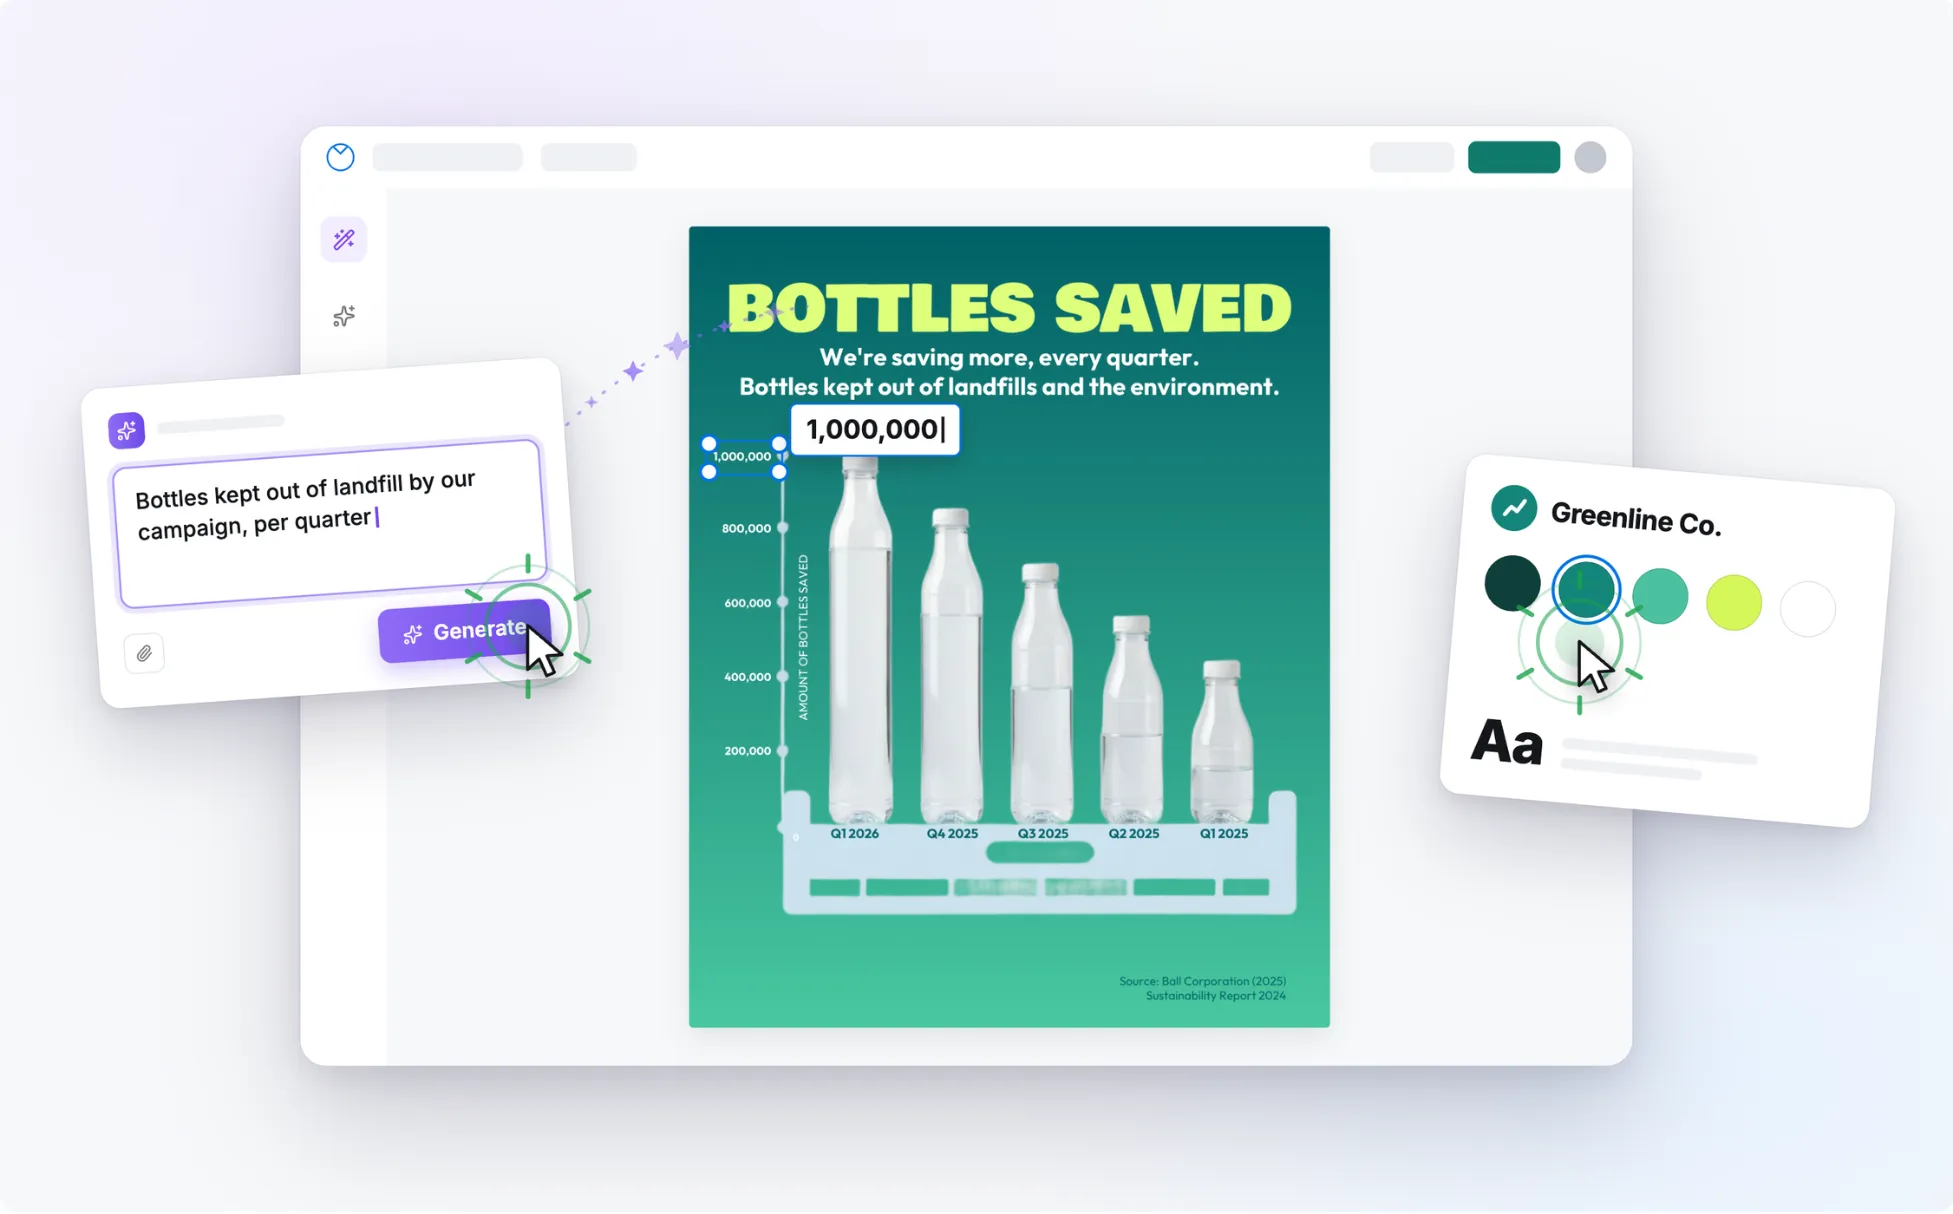
Built For Creators and Founders Who Share Data on Social Media
Give your audience a visual reason to stop scrolling. Paste in your stats and let the subject shape the chart. Sports performance can be shown through jerseys, balls or trophies. Music data can become records or headphones. Your chart stays editable, so you can refine it without starting again.
Generate Infographic Charts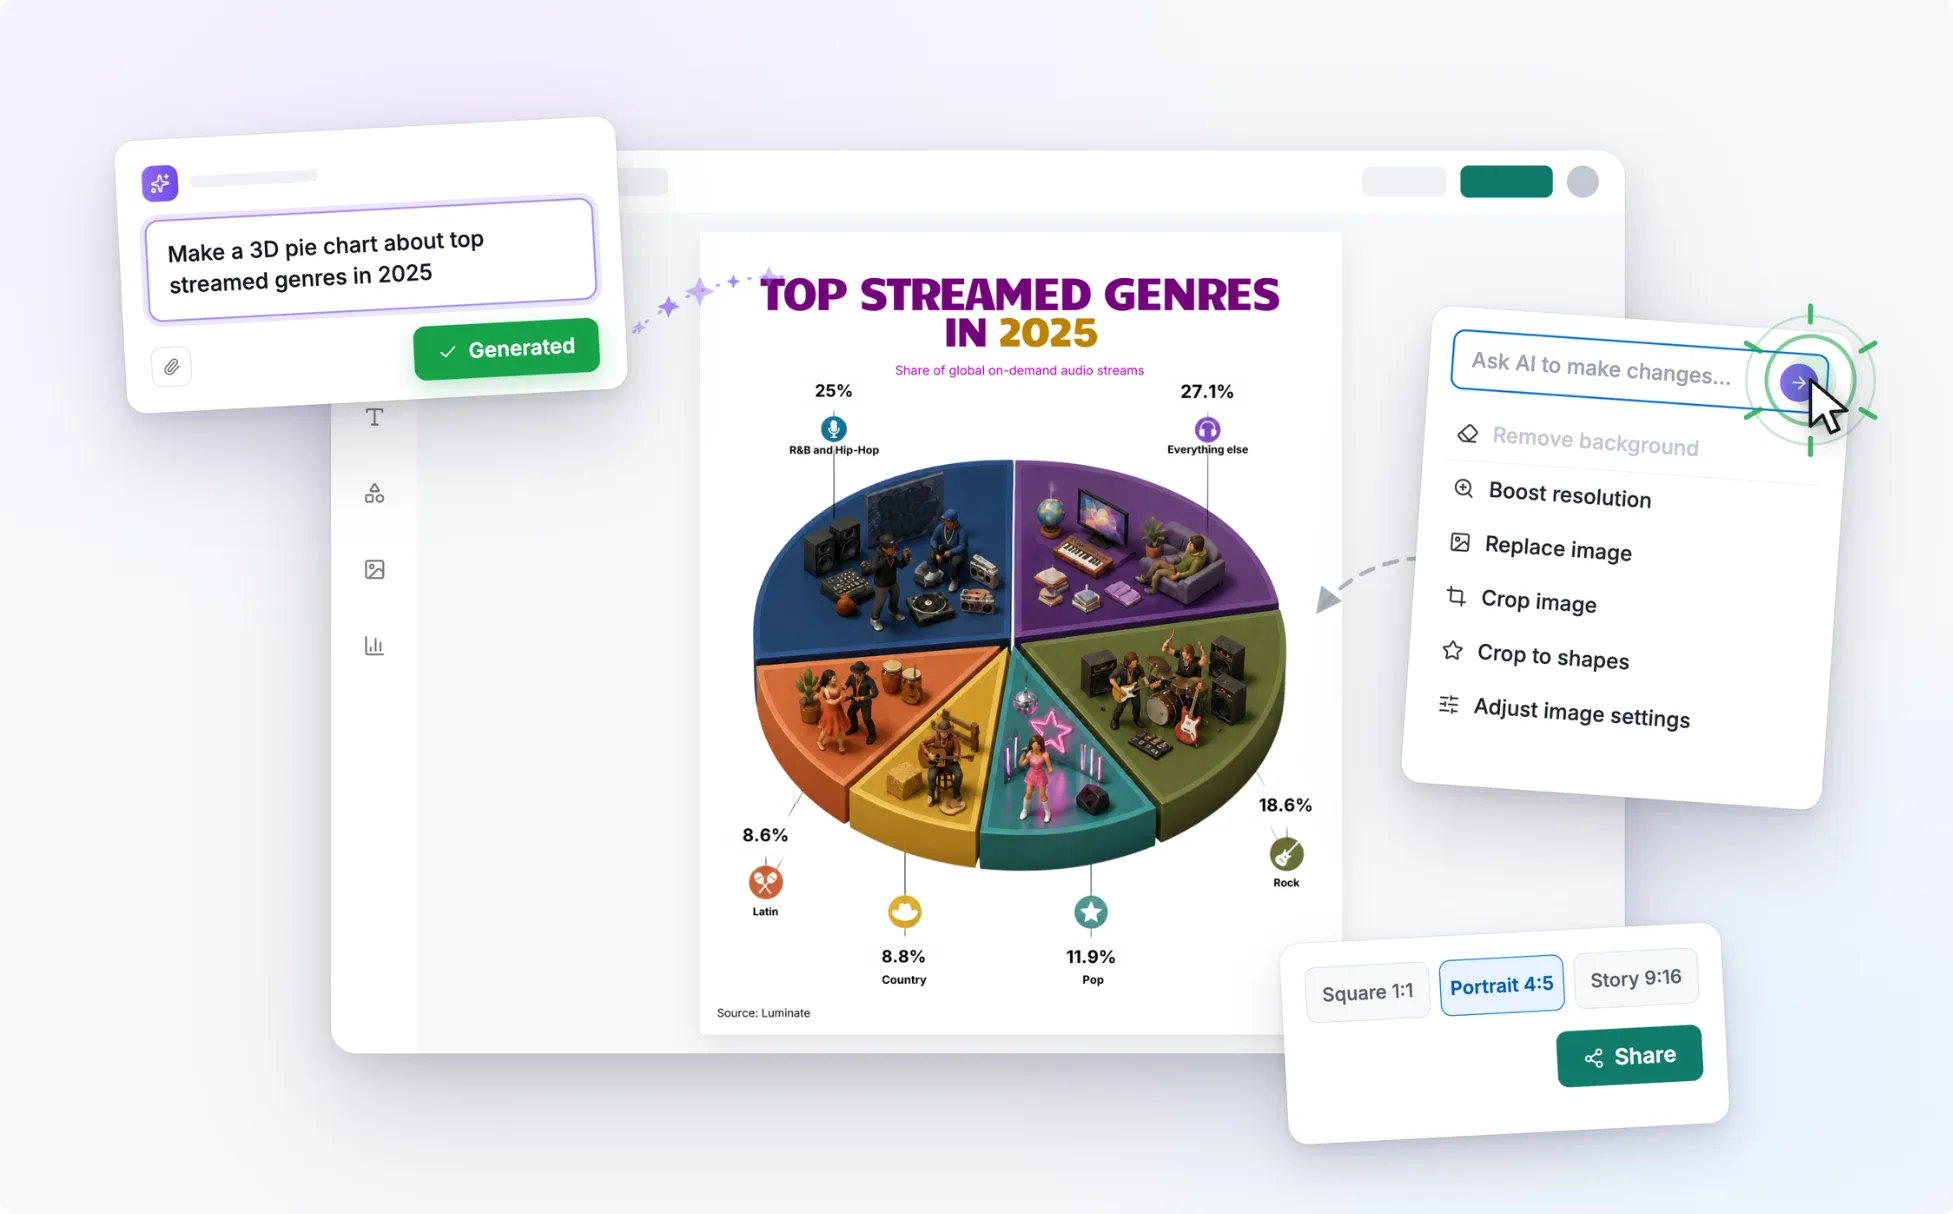
Turn Almost Any Topic Into a Visual Chart
Have a topic but no idea how to make it visual? Let the subject do the work. Books can become bars, light bulbs can show energy use and shopping bags can carry spending data. You bring the idea and the numbers, then customize what comes back.
Generate Infographic Charts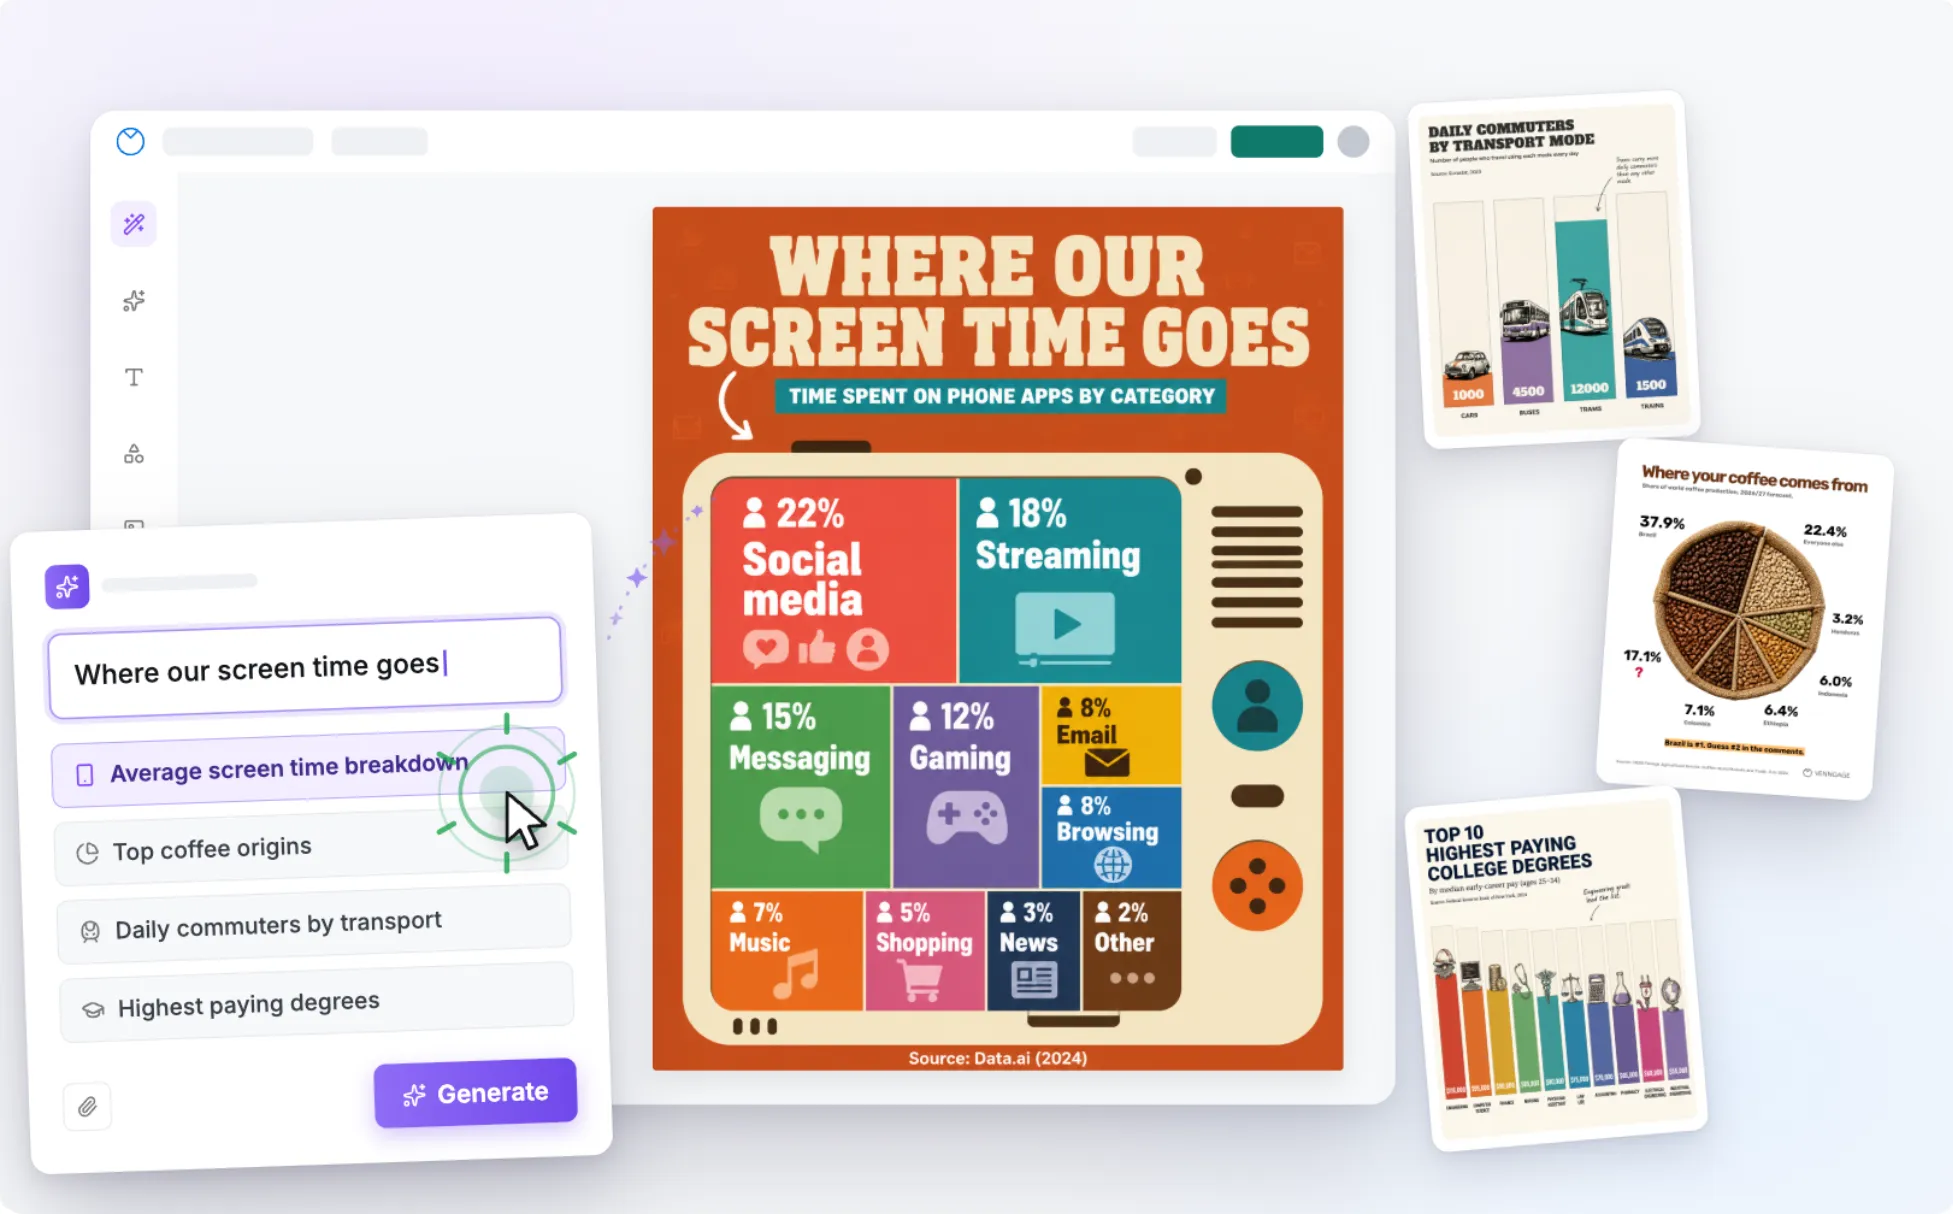
Create A Visual Infographic That Looks Like Its Topic

Charts That Look Like Their Topic
Most charts start with the same familiar shapes. Here, the topic gives the visual its form. Book sales can become stacks of books. Energy use can appear as light bulbs. Tech market share can be built from mobile devices. The result is a creative infographic chart where the visuals help carry the data instead of simply decorating it.

Start With the Data You Have
A traditional infographic chart maker hands you bars and circles to fill in. Here, you paste in figures from a spreadsheet, a report or your own notes, add a short topic, and the AI works out how to show them.

Edit The Result Instead of Starting Over
Your chart opens as editable elements rather than a locked image. Fix a figure, rewrite a label, change an object, move elements around or apply your brand colors and fonts directly in the editor.

Your Numbers, Exactly as You Gave Them
A playful visual should still be something you feel confident publishing. The AI designs around the figures you provide, so the values on your chart match your data.

Create a Visual Infographic That People Remember
Readers recognize the subject before they read the title. Research on pictorial charts found they recalled the message weeks later, with no loss of accuracy.

Save Time on Design Work
Skip the time spent choosing the right objects and figuring out how to arrange them. AI gives you a visual direction and layout to start from, so you can focus on refining the chart and making it your own.
Fuel Your Creativity with AI-Powered Design Tools
Venngage lets you create infographics, flyer, brochure, reports, and more in a single tool. It's a favorite among professionals, educators, and marketers for a reason:
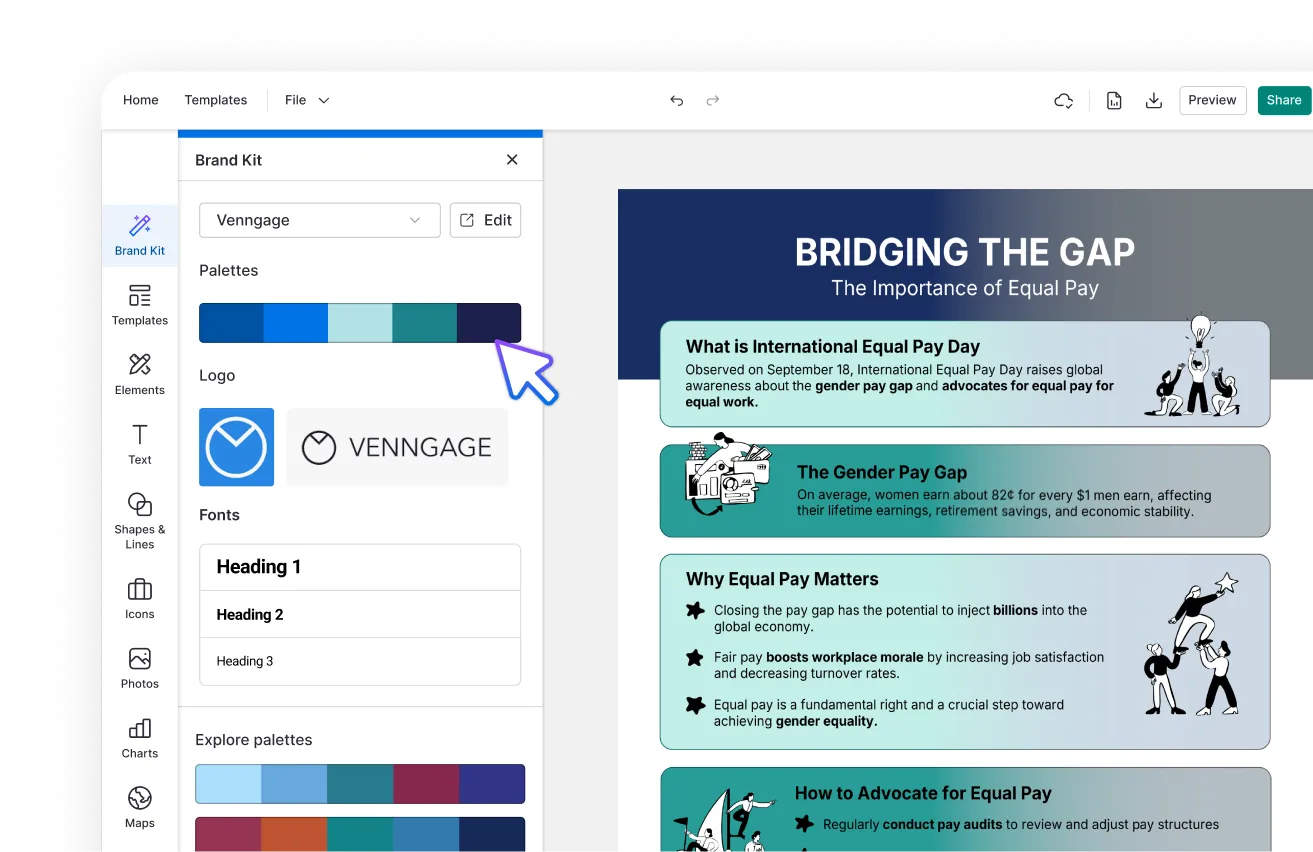
AI Branding Automation
Instantly extract brand colors, fonts, and styles. Auto-apply your logo and visual identity to every design for seamless brand consistency.
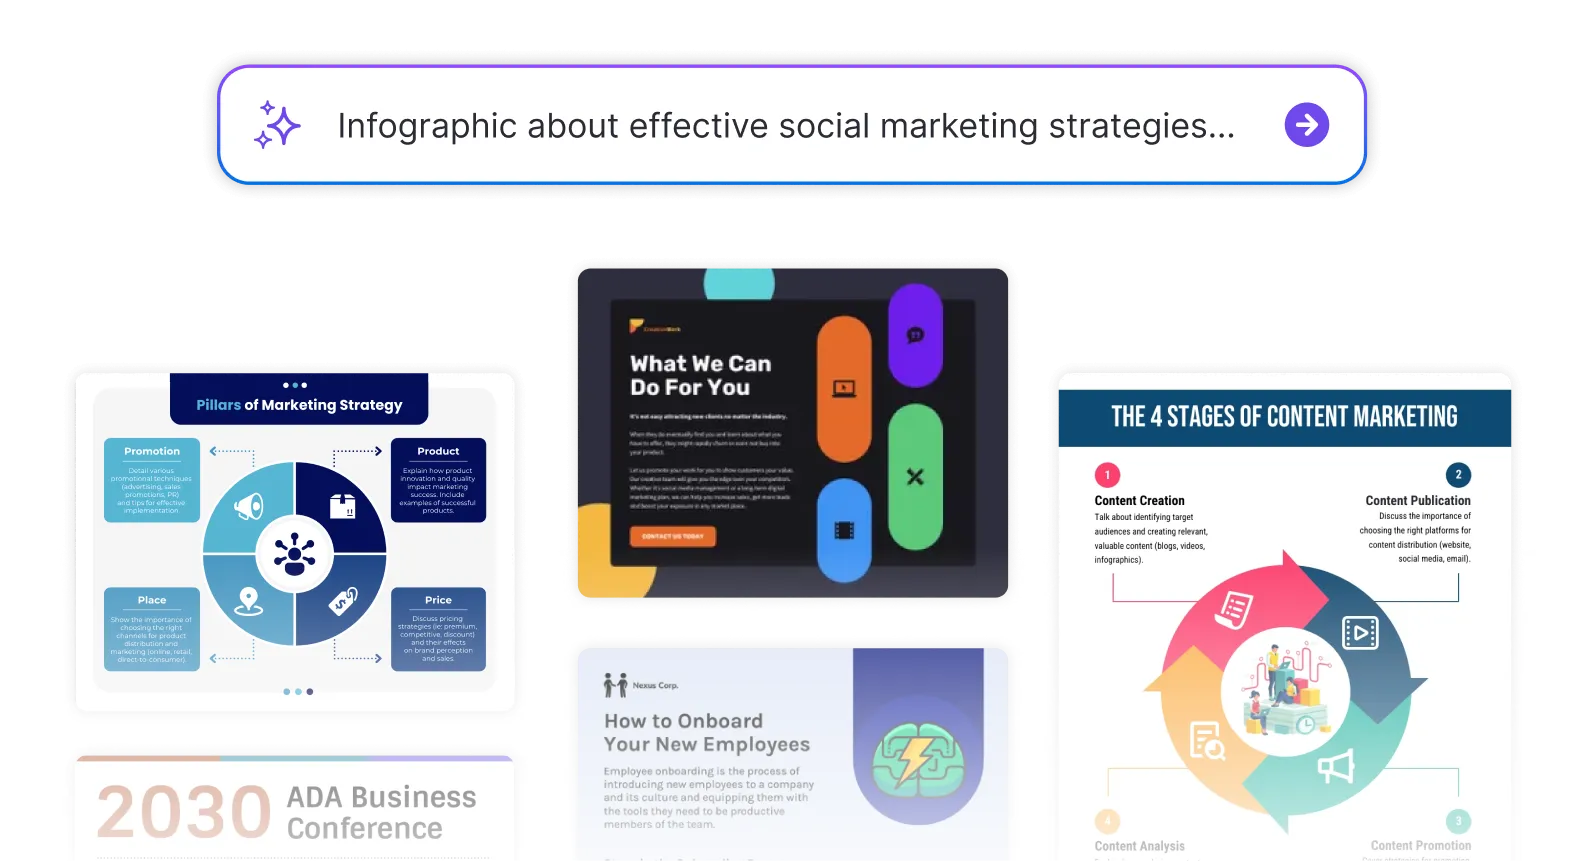
DesignAI Generator
Turn simple prompts into stunning professional visuals in seconds. Describe what you need in plain language and watch our AI generate layouts optimized for maximum visual impact.
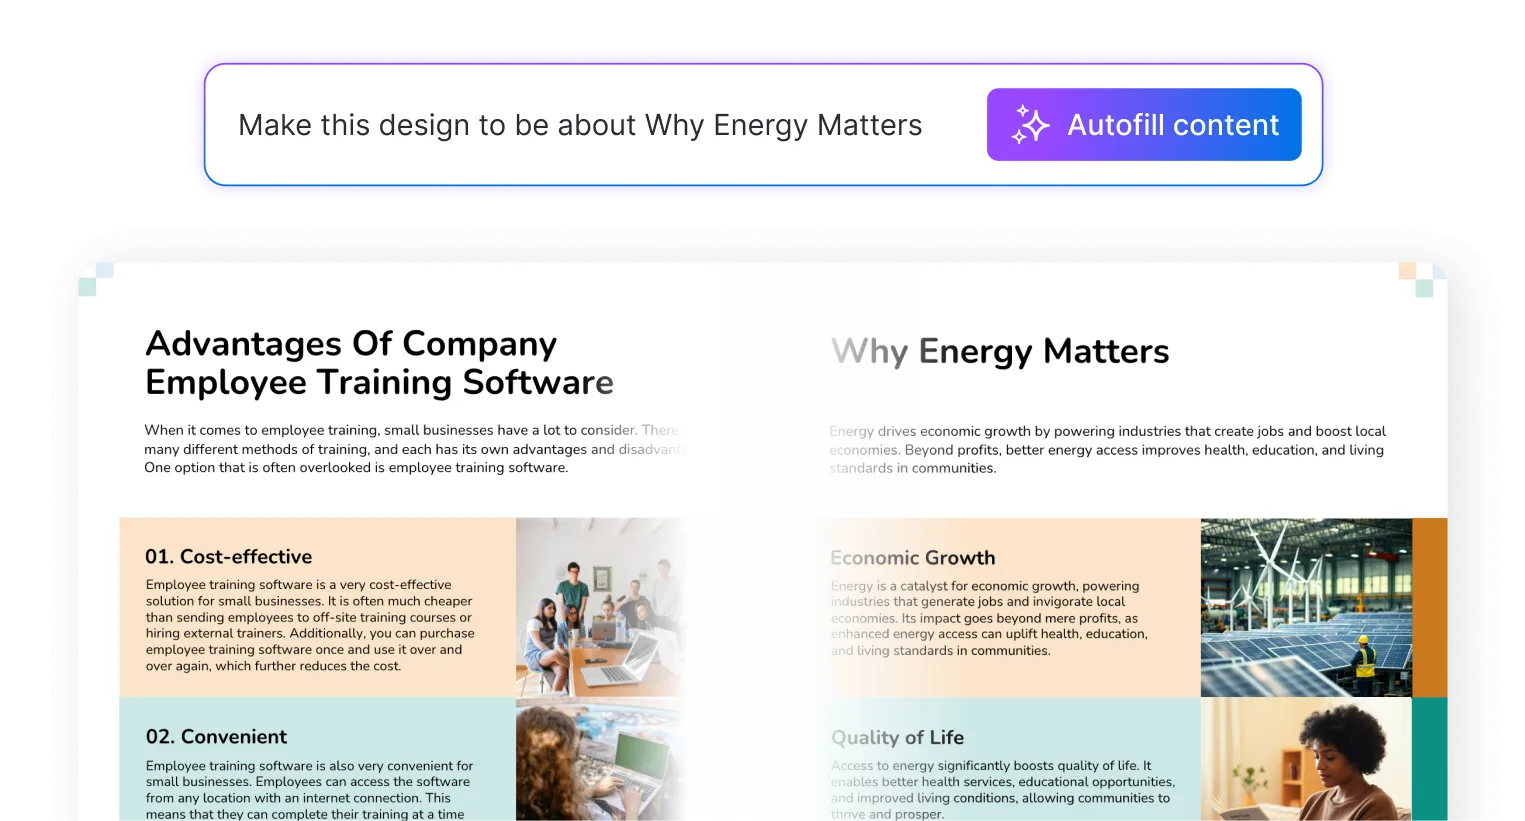
AI Content Auto-Fill
Kickstart your design process in seconds. Choose a template and let our AI auto-fill it with relevant, on-brand content, ideal for streamlining workflow and boosting productivity.
AI-Generated Icons and Images
Create unique visuals that perfectly match your content and style. Generate custom illustrations, icons, and images that align perfectly with your brand.

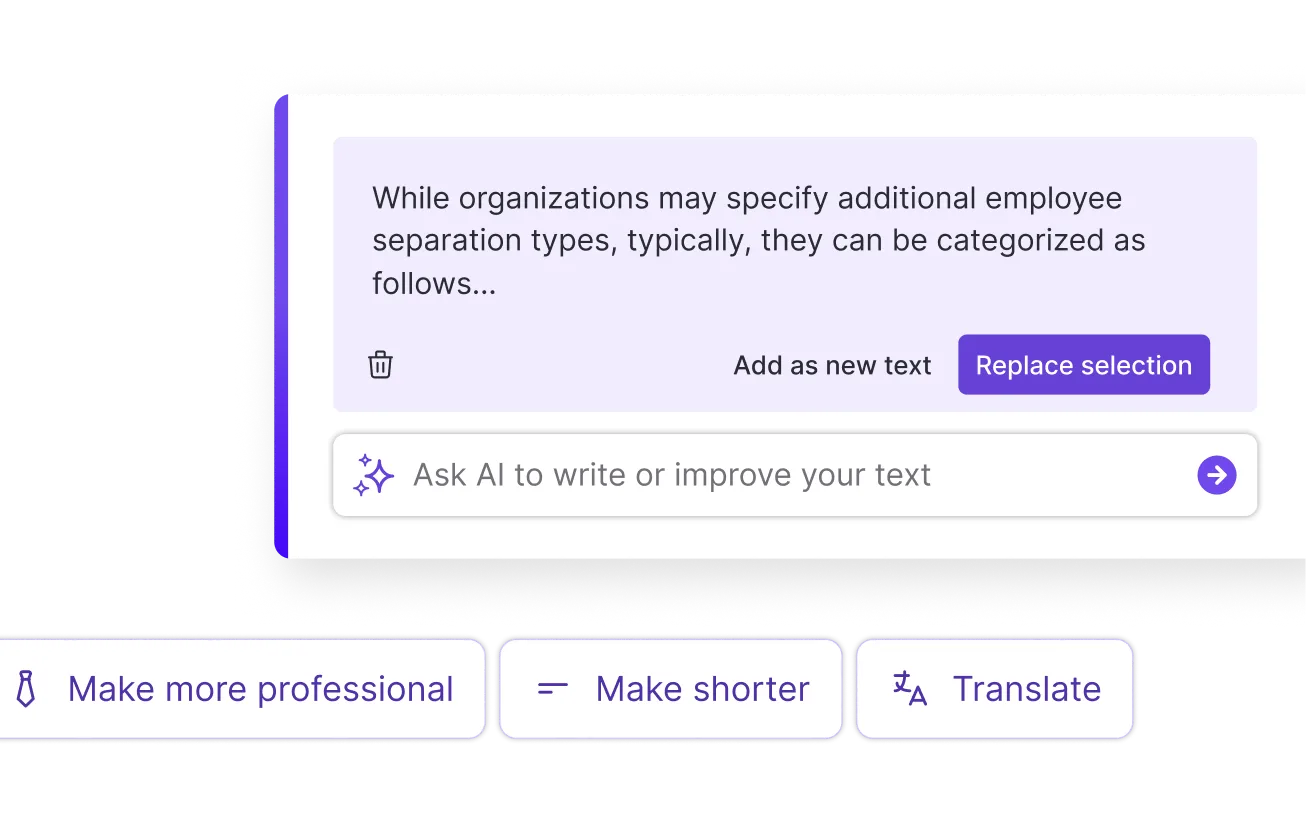
AI Writer and Translation
Enhance clarity, rewrite content, and instantly translate text to create accessible, global-ready visuals.
Smart Accessibility AI
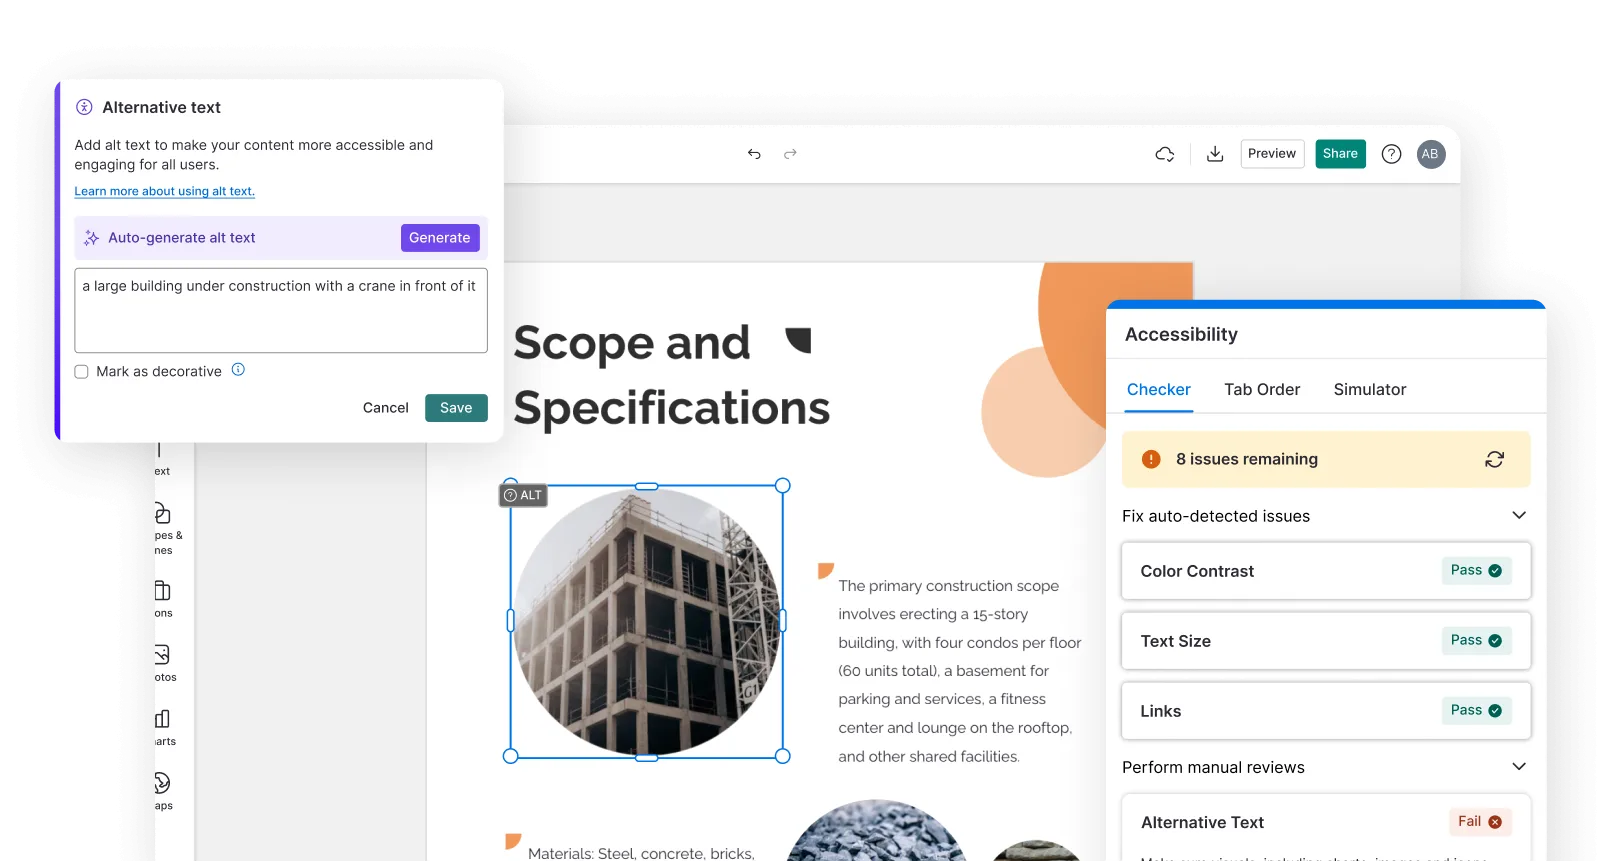
Ensure every project looks great and works for everyone. Use AI to write alt text check contrast, layout, and font readability, and export visuals and PDFs that fully comply with the Web Content Accessibility Guidelines (WCAG).
FAQs
An infographic chart is a chart that uses illustrations, labels, and layout to help explain the data. For example, an infographic chart about coffee might show each value as a stack of cups.
A chart plots one set of data. An infographic combines several elements, such as charts, icons, and text, to explain one topic. So the infographic vs chart question, or chart or infographic, is really about scope. An infographic chart sits in between.
No. A plain pie chart is a chart, not an infographic. It becomes a pie chart infographic once design does part of the work, for example when the slices are drawn as segments of an orange and the takeaway is written on the graphic.
The AI generator specializes in illustrated object charts, so it works best for comparison chart infographics and part-to-whole visuals. For other infographic chart types, the Venngage chart maker and template library cover the rest in the same editor, including infographic bubble charts, infographic waterfall charts, donut charts, infographic flow charts, timeline charts and org chart infographics.
Yes. Pie charts and bar charts are the chart types that the AI handles best. Ask for a pie chart infographic and the slices are drawn as parts of your subject. Ask for a bar chart infographic and the bars become objects. For pie charts, include your percentages in the prompt and check they add up to 100%.Refine the bar chart infographic design or recolor it into a colorful pie chart infographic
You can start with just a topic and the AI will fill in figures for you. For the most accurate chart, paste in your own fact-checked data. The AI designs around your exact numbers, so the finished visual is both accurate and built to fit.
Include your chart topic, your data (if you're pasting it rather than uploading a file), the chart style you want, and any legends or callouts you'd like shown. For example: Bar chart of monthly website visitors in 2024. January 4,200, February 5,100, March 6,800, April 7,300. Add a callout on March for our product launch, and label the y-axis as visitors.
Yes. All AI-generated charts on Venngage's platform are fully customizable. Change values, rewrite labels, swap objects, adjust colors and fonts, and resize the canvas. Apply your Brand Kit in one click or fine-tune every detail by hand.
Browse Venngage’s template library for pie chart infographic examples and bar chart infographic examples to see how different topics have been visualized, or enter a few into the generator and compare results. A good starting point is to ask what your subject is physically made of.
Venngage's free infographic chart generator includes 5 AI generations per day and full access to the infographic template library, with no credit card required. To get private sharing, auto-branding, and higher generation limits, upgrade to a Premium or Business plan.
Yes. The AI-generated infographics created using Venngage's tools are copyright-free. You can use them for both personal and commercial purposes without any restrictions on copyright. However, we recommend that you confirm any externally sourced content you include is cleared for use.
Yes. The AI generator focuses on illustrated object charts, and Venngage's wider chart maker covers the rest in the same editor. The template library has flow chart infographic templates, organizational chart infographic layouts, timeline charts and more, all editable with the same drag-and-drop tools.
Yes, Venngage offers a wide variety of infographic designs to suit different needs and preferences. Whether you're looking for something sleek and modern, or more detailed and data-focused, you'll find numerous options to choose from in our extensive template library.