
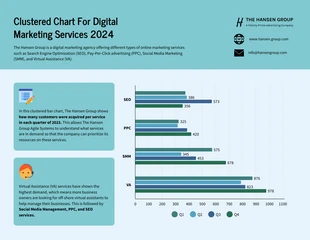
Digital Marketing Services Clustered Bar Graph Template
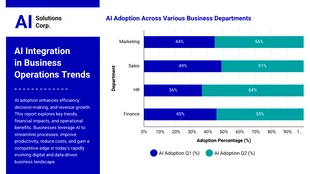
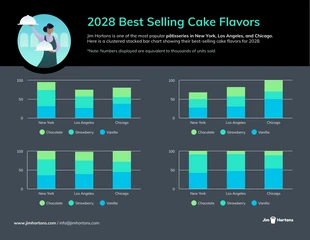
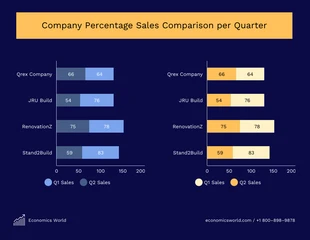
Visualize your data like never before by creating a Clustered Bar Graph — a clear and effective way to compare multiple variables at once!
 100% customizable templates
 Millions of photos, icons, charts and graphics
 AI-powered editing features
 Effortlessly share, download, embed and publish
 Easily generate QR codes for your designs
- SizeLetter (11 x 8.5 in)
- File typePNG, PDF, PowerPoint
- Planpremium
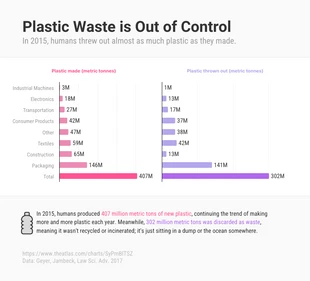
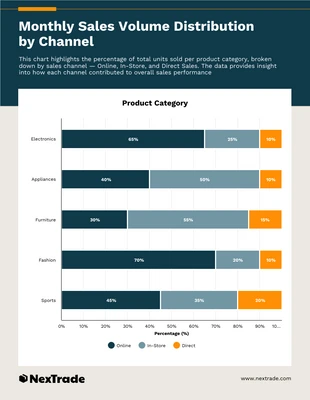
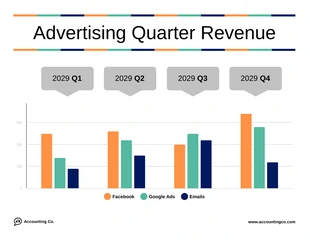
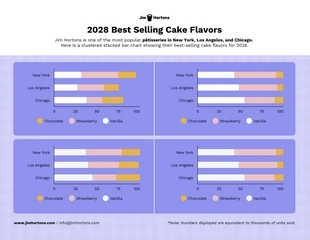
A Clustered Bar Graph compares different data points within a category. The purpose of creating a Clustered Bar Graph is to visualize and analyze the relationship between multiple variables or data points with similar characteristics. This is to show a comparison between the different variables. By organizing the data into categories and using bars to represent the different data points, it becomes easier to compare the values and identify any patterns or trends. This type of graph is particularly useful when comparing data points that are related to each other or when comparing data from different time periods. Overall, a Clustered Bar Graph can help provide insights into complex data and simplify decision-making.
Related charts
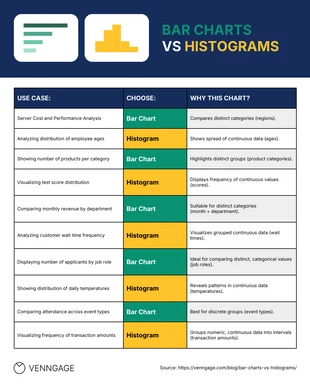
table charts
bar charts
bar charts
stacked charts
mixed charts
stacked charts
bar charts
stacked charts
bar charts
stacked charts
stacked charts