
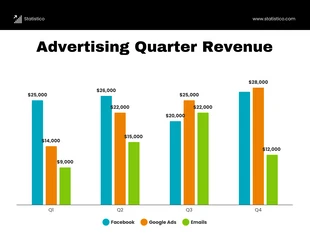
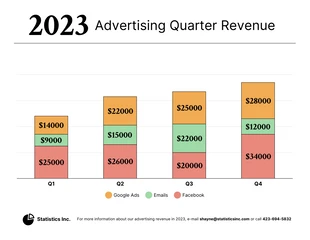
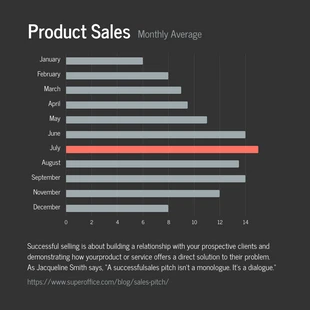
Advertising Revenue Vertical Bar Graph Template
Do you want to create a vertical bar graph? Then check out Venngage, it's a simple chart maker that even a non-designer can use.

 100% customizable templates
 Millions of photos, icons, charts and graphics
 AI-powered editing features
 Effortlessly share, download, embed and publish
 Easily generate QR codes for your designs
- SizeLetter (11 x 8.5 in)
- File typePNG, PDF, PowerPoint
- Planbusiness
A vertical bar graph is a chart that represents data with bars, from highest to lowest. It's useful for comparing sets of data as well as displaying individual values. The heights of the bars correspond to the value of the data they represent. Vertical bar graphs are often used in business reports to display financial data. The bars are typically colored based on their category and placed next to each other so the reader can easily compare them. Vertical bar graphs are useful because they allow users to quickly see a large amount of information at once, without having to compare multiple charts or tables. They can also be used to show trends over time, which is useful when you want your customers to understand how their business has changed over time. Not having any prior knowledge with design or layout might be a major hindrance when creating a template. You can avoid making expensive blunders by starting with a pre-made template. With Venngage, you have access to thousands of pre-made templates that you can modify to create
Related Chart Templates
bar charts
bar charts
stacked charts
table charts
stacked charts
bar charts
bar charts
mixed charts
stacked charts