
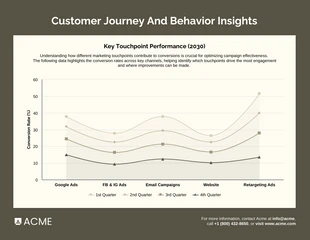
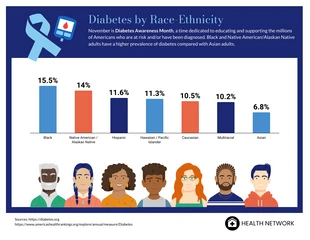
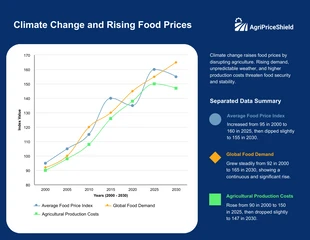
Prostate Cancer Stats by Age in US Bar Chart Template
You can easily customize this Prostate Cancer Stats By Age. Just add your own images, text, and data to make it your very own graphic.
 100% customizable templates
 Millions of photos, icons, charts and graphics
 AI-powered editing features
 Effortlessly share, download, embed and publish
 Easily generate QR codes for your designs
- Design stylemodern
- Colorslight
- SizeLetter (11 x 8.5 in)
- File typePNG, PDF, PowerPoint
- Planfree
Templates are a great way to create consistently polished content. Just set one up and you can use it repeatedly without added effort or cost. The key is to customize the template so that each piece of content looks unique, while still fitting in with your brand’s overall style guide. Here are some tips for using templates effectively: Venngage is a great resource to create infographics of any type. It offers many different templates and gives you the opportunity to personalize them as needed. The platform’s data visualization options make it easy to show the information you want in a clear and concise way so that investors can easily grasp what's important. Using Venngage, it's easy to brand everything from the interface to the fonts and colors to match your company's existing branding thanks to the platform's numerous personalization possibilities. The design should be clean and simple, with a focus on usability. The text should be easy to read and understand. Use icons to help people understand what your design is about. Select a theme that fits the purpose of your design—and
Related charts
stacked charts
bar charts
bar charts
pie charts
line charts
histogram charts
area charts