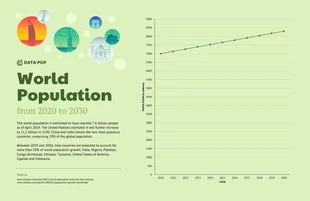
World Population Line Graph Template
Customize this line graph template to create persuasive marketing material and provide professional reports to clients and investors.

 100% customizable templates
 Millions of photos, icons, charts and graphics
 AI-powered editing features
 Effortlessly share, download, embed and publish
 Easily generate QR codes for your designs
- Design stylemodern
- Colorslight
- SizeTabloid (17 x 11 in)
- File typePNG, PDF, PowerPoint
- Planfree
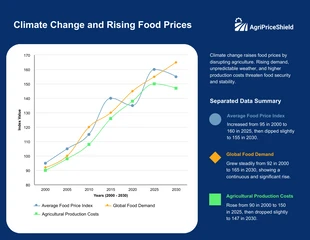
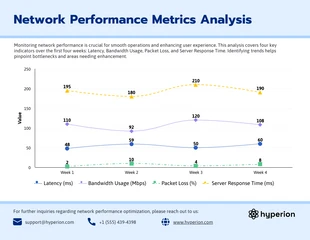
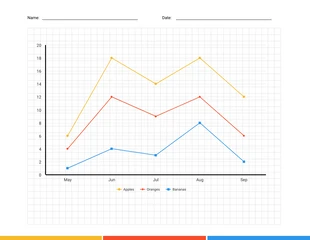
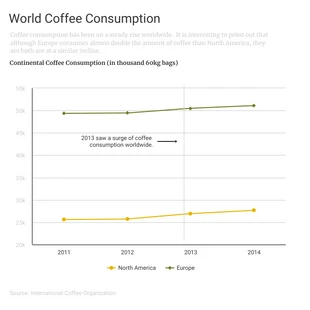
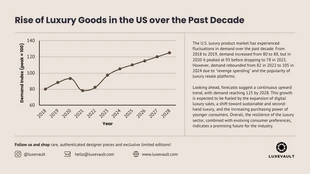
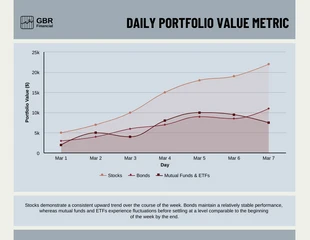
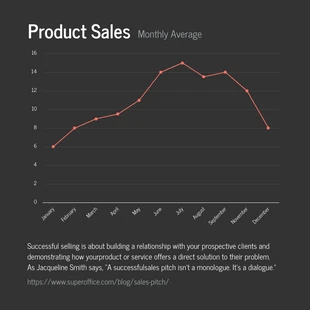
A line graph is a graphical representation of data that changes over time. It uses a series of connected dots or points to represent data values, with the position of each point on the graph indicating the value of the data at a specific time. Line graphs can also be used to compare different data sets, or to analyze trends. When you have data that changes over time and you want to show how the data shifts, a line graph is a good choice for visual aid. For example, you can use a line graph to show the monthly sales of your company or to monitor the daily weather conditions in your area. In creating a line graph, use a consistent scale for all of your data points. This will properly compare data sets and see trends. Use contrasting colors for the lines on your graph so that they are easy to see and follow against their background and in comparison with other lines. Also, label your axes accordingly so that your readers can understand what they are seeing. There are a
Related Chart Templates
line charts
line charts

stacked charts
line charts
line charts
editorial charts
line charts
area charts
line charts