
Monthly Expenses Report Bar Chart Template
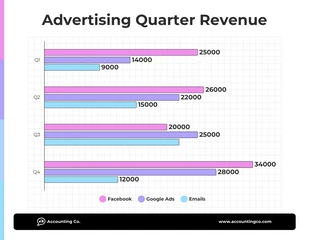
Compare data across multiple categories, track data over time, and organize your data by customizing this 4 column blank chart template.

 100% customizable templates
 Millions of photos, icons, charts and graphics
 AI-powered editing features
 Effortlessly share, download, embed and publish
 Easily generate QR codes for your designs
- Design stylemodern
- Colorslight, vibrant
- SizeLetter (11 x 8.5 in)
- File typePNG, PDF, PowerPoint
- Planpremium
A 4 column blank chart is a table with four columns and no headers. There are a few reasons you might want to use a 4 column blank chart. First, it can be a helpful way to organize data. If you have a lot of data points, organizing them into columns can make it easier to see patterns and trends. Second, you can use it to compare data across multiple categories, like correlating the sales of four different products. Third, you can also use this graph to track data over time, such as following the monthly sales of a product. As the name implies, a 4 column blank chart has four columns. The first column is typically reserved for labels, such as the name of a product or category. The second and third columns are typically used for data points. The fourth column is often left blank but could be used for a total or average. When creating a 4 column blank chart, it's essential to keep a few things in mind: make sure the data is organized in a way that makes sense.
Related Chart Templates
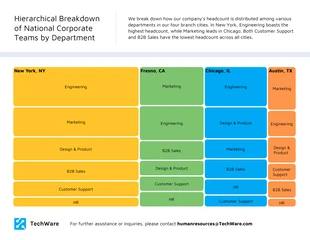
tree map charts
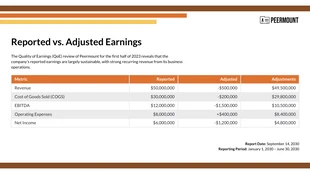
table charts
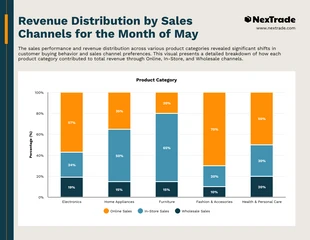
stacked charts
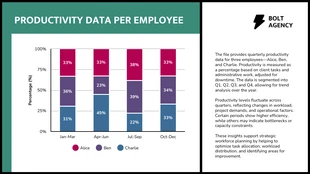
stacked charts

stacked charts

bar charts

column charts
column charts
column charts
stacked charts

tree map charts