
Water Lifecycle Infographic Template
Customize and download this lifecycle infographic to introduce information about a system, process, or product's life cycle stages.

 100% customizable templates
 Millions of photos, icons, charts and graphics
 AI-powered editing features
 Effortlessly share, download, embed and publish
 Easily generate QR codes for your designs
- Design stylefun
- Colorslight, vibrant
- SizeLetter (11 x 8.5 in)
- File typePNG, PDF, PowerPoint
- Planfree
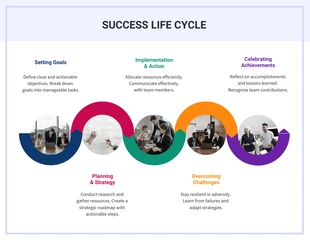
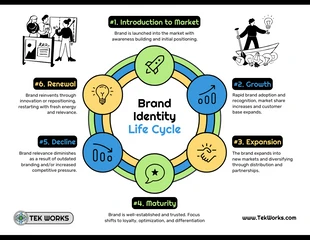
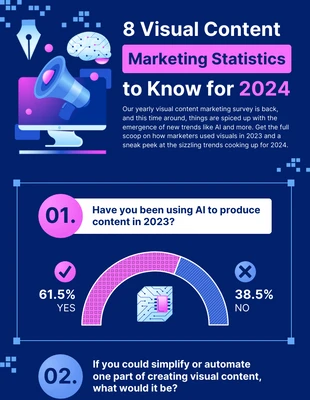
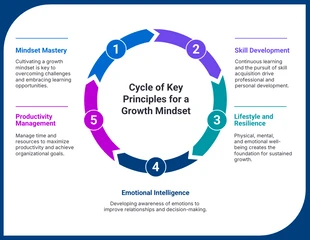
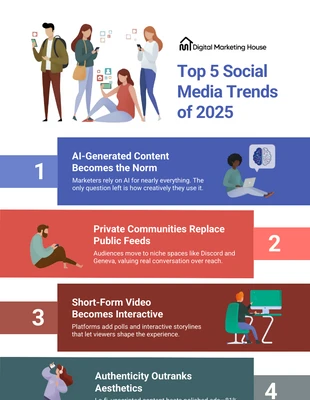
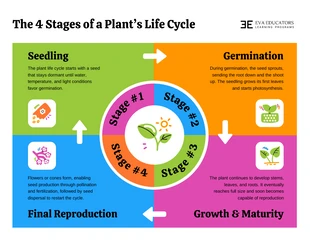
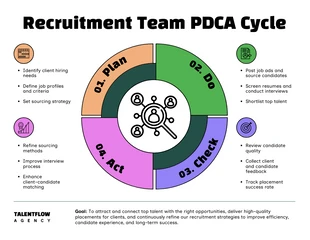
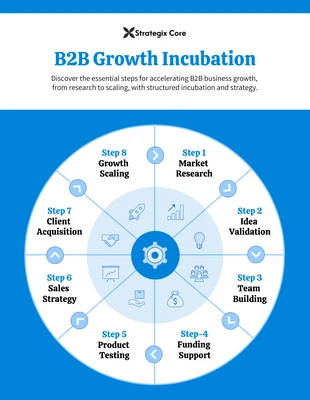
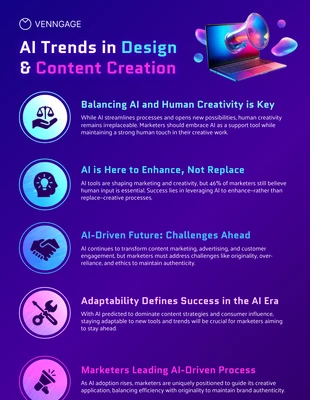
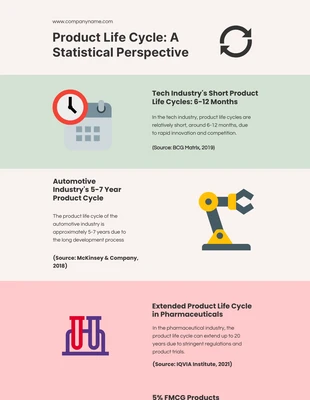
An infographic is an illustrated presentation of data or information. It is a pictorial way to display information that is engaging and easy to understand. Infographics make complex data more coherent and easily digestible. They use charts, graphs, images, and other visuals to more attractively display information. They can effectively communicate educational content, data visualizations, or marketing material. There are many types of infographics according to function and style. One of them is the lifecycle infographic. Lifecycle infographics show the various stages of a process or journey. This type of infographic indicates the steps in a project, the phases in a product's lifecycle, or the different stages in a person's life. Such infographics can be linear or nonlinear. Linear lifecycle infographics show the steps in a process in chronological order. The nonlinear ones, on the other hand, do not necessarily follow an order with a definite beginning and end. They can illustrate different paths a person can take or various options at each process stage. Lifecycle infographics are an effective way to communicate information about growth, change, and development. It shows the audience
Related Infographic Templates
success infographics

marketing infographics
circle infographics

bee infographics
marketing infographics
circle infographics
list infographics
circle infographics
circle infographics
circle infographics
marketing infographics
product infographics