
The Water Lifecycle Ecosystem Infographic Template
Educate people about the ecosystem in an engaging and visually appealing way by creating an ecosystem infographic using this template.

 100% customizable templates
 Millions of photos, icons, charts and graphics
 AI-powered editing features
 Effortlessly share, download, embed and publish
 Easily generate QR codes for your designs
- Design stylemodern
- Colorslight
- SizeLetter (11 x 8.5 in)
- File typePNG, PDF, PowerPoint
- Planpremium
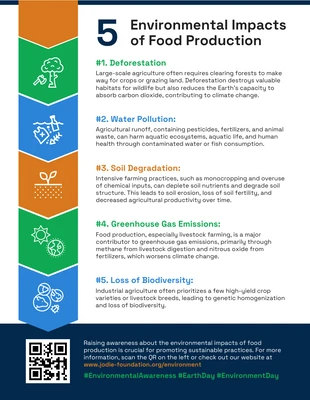
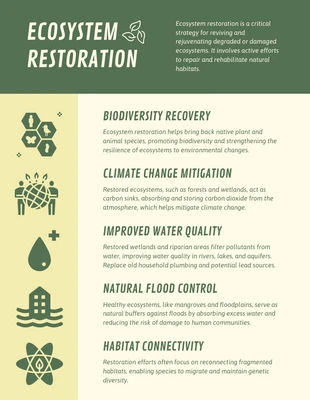
An ecosystem is a gathering of different species of living organisms and their physical environment. Ecosystems are in natural settings like forests or oceans and human-made environments like cities or agricultural land. Humans rely on ecosystems for many things, including food, water, wood, and other resources. We also depend on healthy ecosystems for recreation and tourism. More importantly, they play a vital role in regulating the Earth's climate. The living organisms in an ecosystem interact with one another and their physical environment. These interactions create a series of complex processes that keep the ecosystem in balance. The ecosystem as a topic is broad and complex. To simplify and visualize concepts, making an infographic can help. It can cover the basics of an ecosystem, how they function, and some of the different types that exist. An infographic is a pictorial representation of data or information. It is a graphic way to display information that is both easy to understand and visually appealing. The purpose of an infographic is to make complex data more understandable and easily digestible. An ecosystem infographic is a graphical representation of
Related Infographic Templates
informational infographics
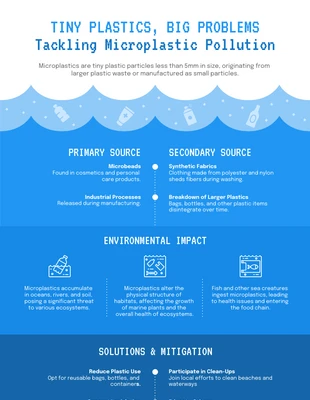
environment infographics
informational infographics
environment infographics
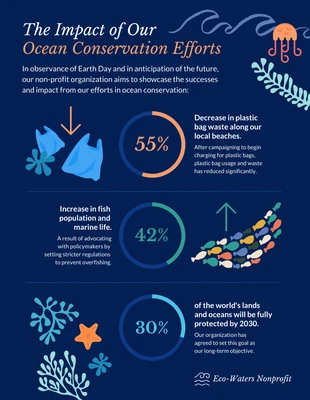
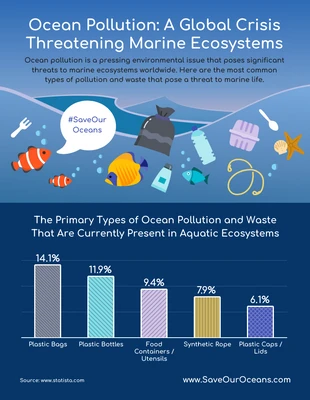
ocean infographics
informational infographics
environment infographics
ocean infographics
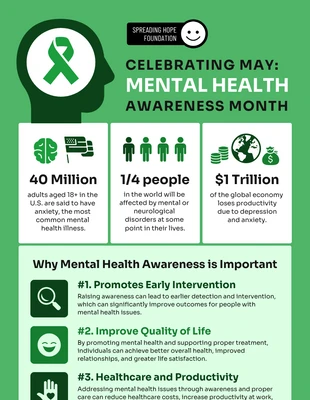
mental health infographics
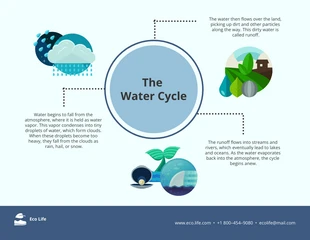
water infographics
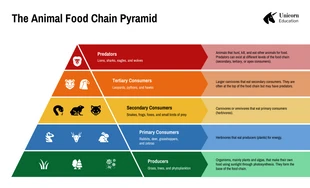
animal infographics