
Billion Dead Animals Ecosystem Heatwave Infographic Template
To help us understand the devastation of the Pacific Northwest Heatwave, this PNW Heat Wave infographic presents a visual story.

 100% customizable templates
 Millions of photos, icons, charts and graphics
 AI-powered editing features
 Effortlessly share, download, embed and publish
 Easily generate QR codes for your designs
- Design stylemodern
- Colorsvibrant
- SizeCustom (816 x 3550 px)
- File typePNG, PDF, PowerPoint
- Planpremium
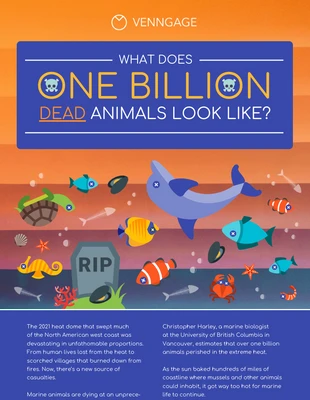
Due to the PNW Heat Wave, marine animals are dying at unprecedented rates. Specifically, the animals that reside along the coastline, such as mussels, clams, sea stars, and dozens of other species. Christopher Harley, a marine biologist at the University of British Columbia in Vancouver, estimates that over one billion animals perished in the extreme heat. This PNW Heat Wave infographic design helps us understand exactly how immense that loss of marine life is. The PNW Heat Wave infographic is also a customizable infographic template for non-designers to create their own data stories or viral infographics. With the aim of helping readers grasp the scale of the PNW heat Wave’s impact on marine life, a professional design uses vibrant colors and illustrations from Venngage’s icon library for a memorable design. Here’s how. Infographics are meant to tell a story, but first have to capture the audience’s attention in an instant. A memorable heading that uses creative fonts to stand out is key, followed by a detailed but brief introduction. This infographic’s heading emphasizes the keywords, so the topic jumps out
Related Infographic Templates
pet infographics
informational infographics
pet infographics
informational infographics
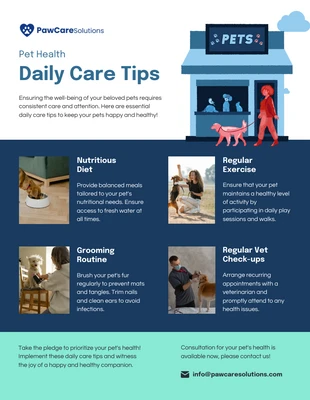
pet infographics

pet infographics
pet infographics
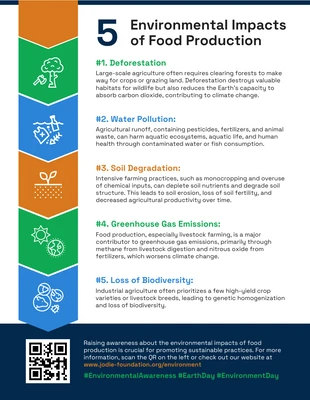
environment infographics
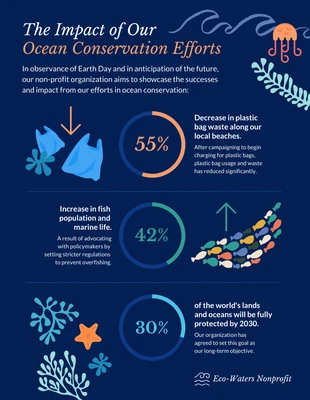
ocean infographics
informational infographics
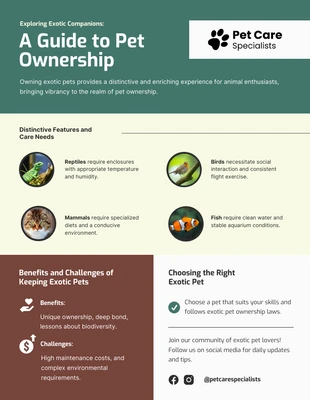
pet infographics
animal infographics