 Infographic Template")
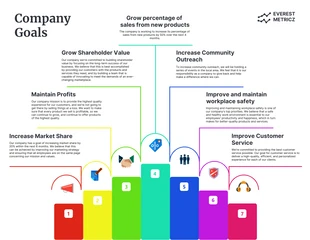
Key Performance Indicators (KPI) Infographic Template
Check out our infographic template to create a professional KPI infographic to project your company's progress with ease. Create one now at Venngage.

 100% customizable templates
 Millions of photos, icons, charts and graphics
 AI-powered editing features
 Effortlessly share, download, embed and publish
 Easily generate QR codes for your designs
- Design stylemodern
- Colorsvibrant, light
- SizeCustom (1680 x 1300 px)
- File typePNG, PDF, PowerPoint
- Planpremium
A KPI infographic is a visual representation of key performance indicators. It's a great way to help users understand the importance of KPIs and how they can be used to measure performance. KPI infographics are a great way to explain complicated concepts in an easy-to-understand format. They make it easy for users to see how KPIs relate to their everyday lives, so they can use them as tools for making decisions. KPI infographics are great because they can be customized for specific industries or organizations, which means that they'll be more useful than generic templates that don't take into account your specific needs and goals. This also means that you won't have to spend time trying to figure out what kind of information is important for your organization—it's already been done! Create something engaging, compelling, and effective without any design experience or skills. By using this KPI infographic template from Venngage, you can create a visual infographic without any design experience. This template allows you to make something beautiful without having to worry about the technical aspects of design, like fonts
Related Infographic Templates
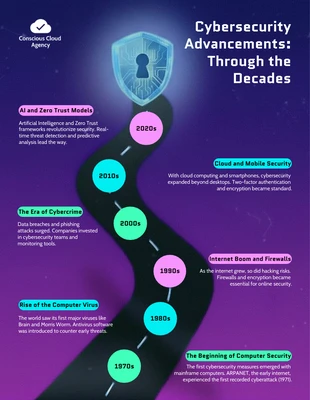
timeline infographics
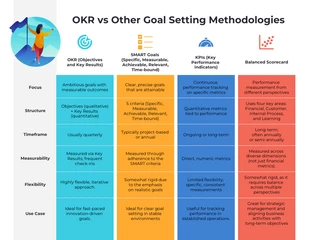
comparison infographics
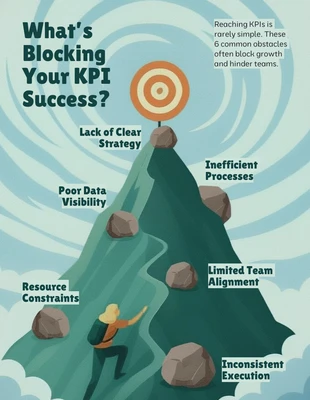
mountain infographics

process infographics
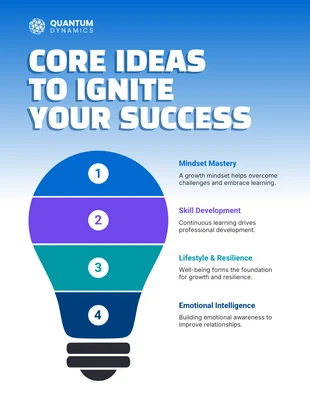
informational infographics
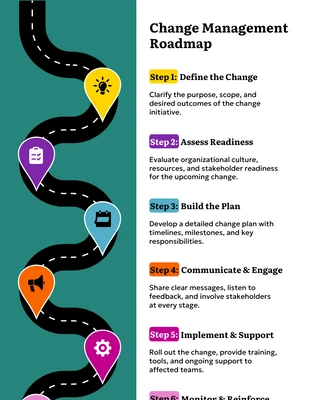
process infographics
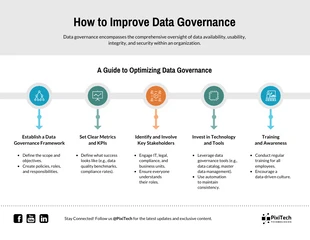
informational infographics
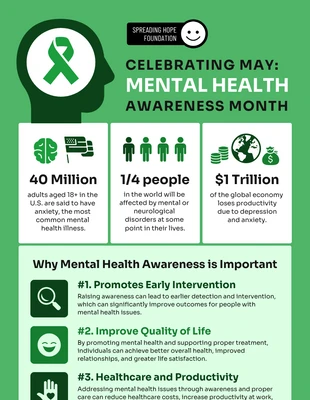
mental health infographics
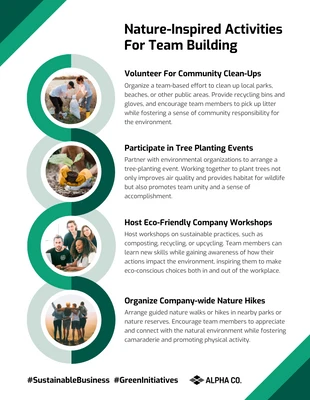
environment infographics
process infographics
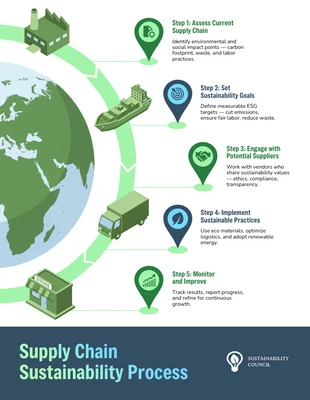
process infographics
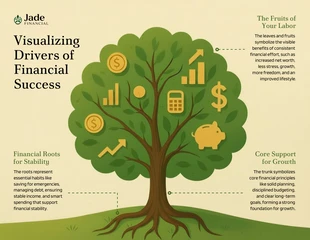
tree infographics