
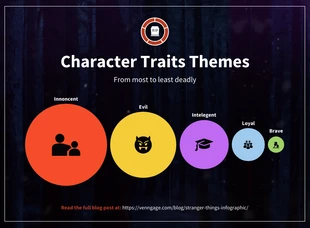
Character Traits Themes Bubble Chart Template
Present your data in an informative, fun, and engaging way by customizing this Stranger Things Character Themes Bubble Chart template.

 100% customizable templates
 Millions of photos, icons, charts and graphics
 AI-powered editing features
 Effortlessly share, download, embed and publish
 Easily generate QR codes for your designs
- Design stylefun
- Colorsdark
- SizeCustom (816 x 600 px)
- File typePNG, PDF, PowerPoint
- Planfree
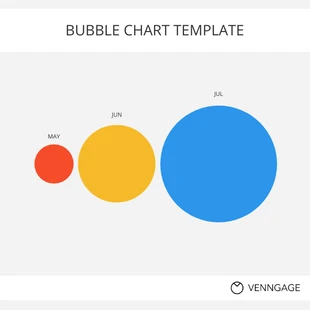
A bubble chart is a type of chart that uses bubbles to represent data. The size of the bubbles symbolizes the amount of data, and you can use the colors of the bubbles to stand for distinct categories of data. You can use bubble charts to show relationships between different variables or to compare data sets. Bubble charts are a popular way to showcase data, and you can use them in various fields. For example, bubble charts have been used to show the relationships between economic indicators, such as gross domestic product and inflation. Bubble charts have also been used to compare the performance of different stocks in the stock market. While easy to create and interpret, remember that bubble charts do not show the data's exact values but only the bubbles' relative sizes. Bubble charts should not be used as the sole basis for decision-making, but they can be a helpful tool for understanding data sets. Creating an effective bubble chart is not demanding, but there are a few things to remember. First, pick the correct data for your chart. The data
Related Chart Templates
bubble charts
bubble charts
bubble charts
column charts

bubble charts
bubble charts
bubble charts
bubble charts

bubble charts

bubble charts